Consider the Source
Anatomy of an anti-vax fact-check: Consider the Source, Check the Site, Confirm the Content. Who made the claim, who published it, where's the evidence?
By Ayurella Horn-Muller (Climate Central), Brendan Rivers (ADAPT), and Danielle Uliano (WJXT)
The Lincolnville Museum and Cultural Center recently raised its air conditioning units 18 inches to protect them from floods. Like many in the historically Black Lincolnville neighborhood in St. Augustine, the museum is coping with more frequent and intense flooding as seas rise and hotter temperatures drive heavier storms.
|
This radio, television and text story was produced through a collaboration involving WJXT, ADAPT from WJCT Public Media, and Climate Central. |
“When we do get high tide or a lot of rain, the streets tend to flood,” museum Executive Director Regina Gayle Phillips says. “There are certain areas that are worse than others.”

The Lincolnville Museum & Cultural Center, housed in the former Excelsior School building constructed in 1925 for black students during segregation. Credit: The Jaxson
About 150 years ago, newly freed slaves established what’s now the Lincolnville Historic District in the marshes bounding Maria Sanchez Creek. A hotbed for racial justice activism, in 1964 the neighborhood was the site of a Martin Luther King Jr. sit-in that helped lead to Congress’ passage of the Civil Rights Act.
Already, parts of Lincolnville are experiencing occasional or frequent flooding, particularly on the east and south sides of the neighborhood. The impacts are amplified by the neighborhood’s paved surfaces and lack of green spaces, which can absorb runoff. Within 30 years, a Climate Central analysis shows more than a dozen locations through the neighborhood will be at risk of chronic flooding unless steps are taken to protect them.
Phillips says the city put in some flooding controls in recent years, but they aren’t enough. Rising water’s threat to the cooling system of the museum is dwarfed by the threat to the community that it was built to chronicle and celebrate. “Sure, you can build back,” she said. “But you know, it doesn’t get built back the way that it was before.”

An 1885 map of St. Augustine showing the location of Lincolnville. Credit: State Archives of Florida
Lincolnville is one of the historic areas in the nation’s oldest continuously occupied European settlement that are threatened by rising seas caused by temperature increases from fossil fuel pollution. Everything, from millennia-old indigenous artifacts to centuries-old Spanish architecture and modern Black history, is at risk.
And so is the local economy. Millions of annual “heritage tourists” spend more than $1.6 million a day.
“St. Augustine lives on its heritage tourism,” said Steven Roberts, the chief of interpretation, education and visitor service at the Castillo de San Marcos fort, the city’s biggest attraction. “It is the bread and butter of the St. Augustine economy.”
Local, state and federal agencies, officials and conservators are working together through a cobbled-together historic preservation and resiliency system to hold back the water. There are financial limits to what they can do.
Similar scenes are playing out across the country. A historic downtown that helps draw 2 million visitors a year to Annapolis, Maryland, floods regularly; officials there are scrambling to fortify hundreds of buildings as the city prepares for flooding 350 days each year by 2040. In Charleston, South Carolina, 3,500 historic buildings are in low-lying areas that are inundated by frequent floods. And historic structures in New Orleans were destroyed by hurricanes Ida and Katrina.
Though it faces a similar flood risk to nearby historic monuments like the Castillo de San Marcos, Lincolnville doesn’t rank as high in the city’s assessment of archaeological value, nor does it contribute as much to the local economy.

An aerial view of the Castillo de San Marcos. Credit: Google Earth
Around 800,000 people visit the Castillo every year — with ticket revenue helping fund its preservation — while the Lincolnville Museum doesn’t see more than 2,500 visitors.
“We don’t get the tour trains coming through here,” said Phillips. “They have given us a lot of different excuses why they can’t come through here.”
St. Augustine Chief Resilience Officer Jessica Beach says the city has spent $10 million on flood projects in Lincolnville. As a national monument, the Castillo is federally owned, and Florida owns and operates a seawall that protects it.
“Overall, this challenge is faced by the entire city,” Beach said. The city has applied for grant funding to update its stormwater master plan to incorporate protecting historic resources; it relies on different revenue sources to help pay for flood protections. “We don’t have all of the answers yet,” she says.
Andrew Rumbach, an associate professor at Texas A&M and member of the Colorado Cultural and Historic Resources Task Force, says the costs of protecting cultural sites from climate change far exceed local government resources.
St. Augustine will eventually have to make “impossible choices” on what sites should be sacrificed, Rumbach says. “This is going to create very real inequalities.”

The Castillo de San Marcos in historic Downtown St. Augustine. Credit: The National Park Service
A 1668 pirate attack on St. Augustine left dozens dead and prompted its Spanish occupiers to build the Castillo de San Marcos to protect against hostile ships. Now, it’s the water itself that threatens the national monument, which is the city’s oldest building and the oldest masonry fortification in the continental U.S.
Built using coquina, a local limestone through which water can easily pass, the fort is increasingly affected by flooding associated with sea level rise. Floodwaters could reach the structure multiple times per year by mid-century, up from today’s average of less than once a year, the Climate Central analysis shows.
When driving and wading through floodwaters is required, fewer visitors come, according to Roberts. The parking lot and surrounding area floods on an almost monthly basis, with seas continuing to rise at a quickening pace.

Flooding at the Castillo de San Marcos’ parking lot. Credit: The National Park Service
For the Castillo, “managed retreat,” or relocating to an area of lower risk, is out of the question. “This is a large fort with more than 300,000 blocks of coquina stone,” Roberts said.
In addition to fortifying sea walls to protect the fort, a virtual adaptation strategy is also underway. University of South Florida Digital Heritage & Humanities Center Director Lori Collins is working with the National Park Service to digitally document it, using drone surveys and handheld laser scanning tools to photograph and record every inch.
While state and federal conservators are collaborating to fortify some historic sites, the onus largely falls on local officials to ensure their city’s cultural resources — and sources of economy — can be saved.
“I think having the historical resources within our city, that’s all the more reason for us to be aggressive with this and do what we can to help protect these critical assets,” says Beach.
This year, Florida passed legislation that earmarks $100 million annually for local government resilience planning and infrastructure. But these programs, along with federal funding opportunities like FEMA’s Flood Mitigation Assistance program, are “really competitive,” she says, and don’t cover the full cost.
How cities source funding to protect cultural heritage from sea-level rise differs.
Beyond federal and state backing, the city of Annapolis is suing 26 oil and gas companies to try to hold them liable for climate change, while Charleston has been loosening design guidelines to reduce homeowners’ costs of elevating historic buildings. Both of these cities also have budgets that dwarf St. Augustine’s $60 million; Annapolis plans to spend $152 million this year, and Charleston $234 million.
“For a small municipality like ours, if we’re talking about a $30 million project, that’s over half of the entire city’s budget,” said Beach. “It’s just not possible for us to be able to do a large project without some type of supplemental funding.”

The Tolomato River laps at the base of a centuries old well at Shell Bluff Landing. Credit: The Florida Public Archaeology Network
Elsewhere in St. Johns County, Shell Bluff Landing is a 6,000-year-old site in Ponte Vedra Beach with a coquina well and a shell mound associated with indigenous groups like the St. Johns, the Timucua and the Guale. Archaeologists are working there to map the shoreline before the ancient site is swept away.
It’s one among many low-lying historic and prehistoric zones in the Southeast at risk of destruction by sea level rise.
“It’s a huge concern,” says Texas A&M Associate Professor Rumbach. “There’s not nearly enough of the kinds of resources we need to protect them to go around.”
Rumbach says policymakers tend to prioritize protecting historic main streets and commercial properties that generate revenue, so the economic value of a site can outweigh cultural or historical significance. “So they can definitely become casualties of a changing climate,” he said.
Shell Bluff is one of more than 16,000 archaeological sites at risk from sea level rise statewide, tracing back to Indigenous origins in Florida almost 15,000 years ago. By the close of the century, nearly half of those sites could be inundated.
Unlike the Lincolnville Historic District and the Castillo de San Marcos, there are no solutions being explored to protect the rapidly eroding shore rife with indigenous heritage. Archaeologist Emily Jane Murray says the state’s strategy revolves around monitoring and mapping. It won’t be long before the site is underwater.
“If this is what’s happening to the places where people used to live now, what’s coming for the places where we live?” Murray said. “These impacts are just kind of gonna snowball.”
Hiya! Welcome back to Starting Out from me and Transom. A few weeks ago I sent out a survey to hear what’s working with the newsletter so far and what you’d like to see in the new year. Thank you all for such thoughtful feedback! One thing I’ve noticed is that recent subscribers have requested […]
The post Starting Out: Issue 5 appeared first on Transom.
Wildfire smoke and urban air pollution bring out the worst in each other.
As wildfires rage, they transform their burned fuel into a complex chemical cocktail of smoke. Many of these airborne compounds, including ozone, cause air quality to plummet as wind carries the smoldering haze over cities. But exactly how — and to what extent — wildfire emissions contribute to ozone levels downwind of the fires has been a matter of debate for years, says Joel Thornton, an atmospheric scientist at the University of Washington in Seattle.
A new study has now revealed the elusive chemistry behind ozone production in wildfire plumes. The findings suggest that mixing wildfire smoke with nitrogen oxides — toxic gases found in car exhaust — could pump up ozone levels in urban areas, researchers report December 8 in Science Advances.
Atmospheric ozone is a major component of smog that can trigger respiratory problems in humans and wildlife (SN: 1/4/21). Many ingredients for making ozone — such as volatile organic compounds and nitrogen oxides — can be found in wildfire smoke, says Lu Xu, an atmospheric chemist currently at the National Oceanographic and Atmospheric Administration Chemical Sciences Laboratory in Boulder, Colo. But a list of ingredients isn’t enough to replicate a wildfire’s ozone recipe. So Xu and colleagues took to the sky to observe the chemistry in action.
Through a joint project with NASA and NOAA, the researchers worked with the Fire Influence on Regional to Global Environments and Air Quality flight campaign to transform a jetliner into a flying laboratory. In July and August 2019, the flight team collected air samples from smoldering landscapes across the western United States. As the plane passed headlong through the plumes, instruments onboard recorded the kinds and amounts of each molecule detected in the haze. By weaving in and out of the smoke as it drifted downwind from the flames, the team also analyzed how the plume’s chemical composition changed over time.
Using these measurements along with the wind patterns and fuel from each wildfire sampled, the researchers created a straightforward equation to calculate ozone production from wildfire emissions. “We took a complex question and gave it a simple answer,” says Xu, who did the work while at Caltech.
As expected, the researchers found that wildfire emissions contain a dizzying array of organic compounds and nitrogen oxide species among other molecules that contribute to ozone formation. Yet their analysis showed that the concentration of nitrogen oxides decreases in the hours after the plume is swept downwind. Without this key ingredient, ozone production slows substantially.
Air pollution from cities and other urban areas is chock full of noxious gases. So when wildfire smoke wafts over cityscapes, a boost of nitrous oxides could jump-start ozone production again, Xu says.
In a typical fire season, mixes like these could increase ozone levels by as much as 3 parts per billion in the western United States, the researchers estimate. This concentration is far below the U.S. Environmental Protection Agency’s health safety standard of 70 parts per billion, but the incremental increase could still pose a health risk to people who are regularly exposed to smoke, Xu says.
With climate change increasing the frequency and intensity of wildfires, this new ozone production mechanism has important implications for urban air quality, says Qi Zhang, an atmospheric chemist at the University of California, Davis who was not involved in the study (SN: 9/18/20). She says the work provides an “important missing link” between wildfire emissions and ozone chemistry.
The findings may also pose a challenge for environmental policy makers, says Thornton, who was not involved in the research. Though state and local authorities set strict regulations to limit atmospheric ozone, wildfire smoke may undermine those strategies, he says. This could make it more difficult for cities, especially in the western United States, to meet EPA ozone standards despite air quality regulations.
Download a transcript of this episode here. I can think of two rock-solid reasons why radio should be a subject for podcasts (and for radio broadcasters, too). And I don’t mean actual radios, I mean radio history and culture — stories about a medium that has been a staple of daily life for generations. The […]
The post Darts and Laurels appeared first on Transom.
Virginia’s Tangier Island is rapidly disappearing. Rising sea levels are exacerbating erosion and flooding, and could make the speck of land in the Chesapeake Bay uninhabitable within the next few decades. For years, island residents, policy makers and others have debated whether to attempt to save the island or relocate its small community elsewhere. But time to decide is running out, says David Schulte, a marine biologist with the U.S. Army Corps of Engineers.
Crucially, that choice will signal how other groups most at risk from climate change, “which are often Native American, minority or low-income such as the isolated fishing community of Tangier, will have their needs addressed — or ignored,” Schulte and his colleague Zehao Wu write in a new study.
The island’s sole town, Tangier, is located on three upland ridges that have largely been protected from coastal erosion. By analyzing aerial photographs of the area from 1967 to 2019, Schulte and Wu, a field researcher at Biogenic Solutions Consulting in Newport News, Va., found that nearly 62 percent of the ridges have been lost to sea level rise. What’s left will convert completely to a wetland by 2051 — about a decade earlier than previously thought — the researchers report November 8 in Frontiers in Climate.
Already, frequent flooding has turned the front yards of many Tangier homes into marshland, Schulte says. Empty parking lots and elevated homes, schools and sidewalks “are all signs of just how bad it is out there.”
Just 436 people lived on the island as of 2020, and that number could drop to zero by 2053, Schulte and Wu’s analysis of population trends suggests. Many factors, including fewer employment opportunities, play a role in the island’s population decline, the researchers say. The shrinking area of dry land has probably convinced people to leave as well.
Protecting and restoring Tangier Island might persuade some residents to stay, but it comes with a hefty price tag: between $250 million to $350 million, Schulte and Wu estimate. That money would fund a medley of interventions, including installing stone along the shoreline to fight erosion and raising the upland ridges by 3 meters using sand from the Chesapeake Bay. Moving a cubic meter of sand from the bottom of the bay to the island costs about $20. Considering the amount of sand needed to raise the ridges, “it gets very expensive really quick,” Schulte says.
Relocating Tangier residents is about $150 million cheaper, the researchers calculate. That estimate is based on others from the Corps and the U.S. Government Accountability Office to relocate U.S. coastal communities such as the towns of Shishmaref, Kivalina and Newtok in Alaska, the Quinault Indian Nation village of Taholah in Washington and Isle de Jean Charles in Louisiana.
But moving a town requires more than finding a place for residents to live, Schulte says. Infrastructure such as schools, medical facilities, grocery stores and restaurants need to be moved or rebuilt to provide the community with a similar lifestyle. For Tangier, the lack of land access to nearby towns adds to the cost of relocating, which must be done via boat, Schulte says.
As the planet warms and oceans swell, an increasing number of other coastal towns and cities in the United States and around the world will probably face a similar choice as Tangier. The cost to save or relocate each one would, of course, differ, Schulte says. Some communities may not be as expensive to move as offshore Tangier, he speculates, but would certainly be in the ballpark.
Sea level rise has been driven, in part, by human activities in bigger cities (SN: 8/9/21). But it is shorelines, often inhabited by Native Americans, minority or low-income communities, that are the first to bear the brunt of this consequence of climate change, Wu notes. That makes it even more essential to draw attention to these overlooked communities, he says.
False claims and conspiracy theories about the new Covid-19 variant Omicron emerged online after the variant was reported by South Africa to the World Health Organization (WHO) on November 24. The WHO said the variant has had a large number of mutations and may present an increased risk of reinfection, but studies on its transmissibility, severity of infection (including symptoms), performance of vaccines and diagnostic tests, and effectiveness of treatments are still underway.
Conservative influencers are circulating claims that the variant is part of a government plan to oppress unvaccinated populations.
In a Facebook Live that was broadcast November 30, conservative radio show host Ben Ferguson alleged that the government is using the Omicron variant to “fearmonger” and to perpetuate “Covid racism” by separating society into those who are vaccinated and those who are not. Ferguson also claimed in the video, which had been shared over 600 times and garnered over 26,000 views as of December 3, that the government is pushing for people to get booster shots through the purported fear mongering.
Other conservative influencers, including Ben Shapiro, Chuck Callesto, Kim Iversen, and Candace Owens, said that the Omicron variant was being used to enforce another lockdown and frighten people into getting vaccinated. One post from Owens implying Covid-19 was being used to “usher in a totalitarian new world order” was shared over 44,000 times on Facebook; the original tweet garnered over 19,000 retweets.
One popular false narrative from supporters of ivermectin has been that the Omicron variant was either made up or deliberately released by proponents of the Covid-19 vaccine in Africa. According to this conspiracy theory, up until last week the African continent had been successful in fending off the pandemic because of the prevalent use of the “miracle drug” ivermectin despite its low vaccination rate. According to the Food and Drug Administration, currently available data shows that ivermectin is not effective in treating Covid-19.
Perhaps one of the most prominent examples came from Rep. Marjorie Taylor Greene (R-GA), who has frequently promoted QAnon and other conspiracy theories. In a series of tweets November 27, she amplified this conspiracy theory, falsely claiming that “many clinical trials have proven Ivermectin to be a very effective safe & cheap treatment against #Covid”.’ These tweets have been shared thousands of times.
In Australia, a number of rumors have also been circulating. Public Facebook posts that mention Omicron with the most interactions between November 22 and 29 are from MP George Christensen, far-right figure Lauren Southern and anti-lockdown activist Topher Field. Each of these posts gained thousands of interactions within 24 hours.
One of the most popular false claims is that Omicron appears “ahead of schedule,” citing a chart purportedly from the WHO, the World Economic Forum (WEF) and Johns Hopkins University with a predetermined “plan” for releasing the variants. Spokespeople from the WHO, WEF and Johns Hopkins told First Draft in email statements that they are not associated with the image. The chart has circulated online since at least July and has also been debunked by Reuters Fact Check, Snopes and India Today.
Other false claims among the Facebook posts include calling the variant “planted” and blaming vaccinated people for the variant. One claim also falsely declared that vaccines weakened people’s immunity. Similarly in a Telegram group with more than a million members, one post falsely stated that the Covid-19 vaccines are what caused Omicron.
A prominent conspiracy theory links the new variant’s emergence to Ghislaine Maxwell’s sex-trafficking trial, which started in the US on November 29. For example, one comment on Topher Field’s post shares a screenshot of a post from US conservative influencer Rogan O’Handley, or DC Draino, that reads in part: “If you think the Omicron hysteria popping up 2 days before the Ghislaine Maxwell trial starts is just a ‘coincidence,’ then you don’t know who she was trafficking underage girls to.” Similar comments are also found on George Christensen’s post and a Telegram post, which also ties Omicron to the QAnon conspiracy theory of a “tyrannical peadophile CV19 government.”
Another conspiracy theory states that the letters “o,” “m” and “i” in Omicron stand for “occlusion” and “myocardial infarction,” linking without evidence the new variant to the rare side effects, such as a rare blood clotting disorder and myocarditis, that some Covid-19 vaccines have caused in a small number of people.
Our research finds a notable data void on Omicron, even though assessments take time. The deficit in data needs to be filled with credible information from trusted sources and facilitated by precise, accurate reporting as soon as possible to stop the spread of baseless or false information about the variant and the pandemic. — Esther Chan, Kaylin Dodson
The post False claims and conspiracy theories about Omicron emerge online alongside the new variant appeared first on First Draft.
The Southern Ocean is still busily absorbing large amounts of the carbon dioxide emitted by humans’ fossil fuel burning, a study based on airborne observations of the gas suggests. The new results counter a 2018 report that had found that the ocean surrounding Antarctica might not be taking up as much of the emissions as previously thought, and in some regions may actually be adding CO₂ back to the atmosphere.
It’s not exactly a relief to say that the oceans, which are already becoming more acidic and storing record-breaking amounts of heat due to global warming, might be able to bear a little more of the climate change burden (SN: 4/28/17; SN: 1/13/21). But “in many ways, [the conclusion] was reassuring,” says Matthew Long, an oceanographer at the National Center for Atmospheric Research in Boulder, Colo.
That’s because the Southern Ocean alone has been thought to be responsible for nearly half of the global ocean uptake of humans’ CO₂ emissions each year. That means it plays an outsize role in modulating some of the immediate impacts of those emissions. However, the float-based estimates had suggested that, over the course of a year, the Southern Ocean was actually a net source of carbon dioxide rather than a sink, ultimately emitting about 0.3 billion metric tons of the gas back to the atmosphere each year.
In contrast, the new findings, published in the Dec. 3 Science, suggest that from 2009 through 2018, the Southern Ocean was still a net sink, taking up a total of about 0.55 billion metric tons of carbon dioxide each year.
The 2018 study had used newly deployed deep-diving ocean floats, now numbering almost 200, that are part of a project called Southern Ocean Carbon and Climate Observations and Modeling, or SOCCOM. Calculations based on data collected from 2014 through 2017 by 35 of the floats suggested that parts of the ocean were actually releasing a great deal of carbon dioxide back into the atmosphere during winter (SN: 6/2/19). That sparked concerns that the Southern Ocean’s role in buffering the impacts of climate change on Earth might not be so robust as once thought.
Long says he and other researchers were somewhat skeptical about that takeaway, however. The floats measure temperature, salinity and pH in the water down to about 2,000 meters, and scientists use those data to calculate the carbon dioxide concentration in the water. But those calculations rest on several assumptions about the ocean water properties, as actual data are still very scarce. That may be skewing the data a bit, leading to calculations of higher carbon dioxide emitted from the water than is actually occurring, Long suggests.
Another way to measure how much carbon dioxide is moving between air and sea is by taking airborne measurements. In the new study, the team amassed previously collected carbon dioxide data over large swaths of the Southern Ocean during three separate series of aircraft flights — one series lasting from 2009 to 2011, one in the winter of 2016 and a third in several periods from 2016 to 2018 (SN: 9/8/11). Then, the researchers used those data to create simulations of how much carbon dioxide could possibly be moving between ocean and atmosphere each year.
The float-based and aircraft-based studies estimate different overall amounts of carbon dioxide moving out of the ocean, but both identified a seasonal pattern of less carbon dioxide absorbed by the ocean during winter. That indicates that both types of data are picking up a real trend, says Ken Johnson, an ocean chemist at the Monterey Bay Aquarium Research Institute in Moss Landing, Calif., who was not involved in the research. “We all go up and down together.”
It’s not yet clear whether the SOCCOM data were off. But to better understand what sorts of biases might affect the pH calculations, researchers must compare direct measurements of carbon dioxide in the water taken from ships with pH-based estimates at the same location. Such studies are under way right now off the coast of California, Johnson says.
The big takeaway, Johnson says, is that both datasets — as well as direct shipboard measurements in the Southern Ocean, which are few and far between — are going to be essential for understanding what role these waters play in the planet’s carbon cycle. While the airborne studies can help constrain the big picture of carbon dioxide emissions data from the Southern Ocean, the floats are much more widely distributed, and so are able to identify local and regional variability in carbon dioxide, which the atmospheric data can’t do.
“The Southern Ocean is the flywheel of the climate system,” the part of an engine’s machinery that keeps things chugging smoothly along, Johnson says. “If we don’t get our understanding of the Southern Ocean right, we don’t have much hope for understanding the rest of the world.”
When it comes to storing carbon in the ground, fungi may be key.
Soils are a massive reservoir of carbon, holding about three times as much carbon as Earth’s atmosphere. The secret behind this carbon storage are microbes, such as bacteria and some fungi, which transform dead and decaying matter into carbon-rich soil.
But not all carbon compounds made by soil microbes are equal. Some can last for decades or even centuries in the soil, while others are quickly consumed by microbes and converted into carbon dioxide that’s lost to the atmosphere. Now, a study shows that fungi-rich soils grown in laboratory experiments released less carbon dioxide when heated than other soils.
The result suggests that fungi are essential for making soil that sequesters carbon in the earth, microecologist Luiz Domeignoz-Horta and colleagues report November 6 in ISME Communications.
Who is making soil matters, Domeignoz-Horta says.
The study comes as some scientists warn that climate change threatens to release more carbon out of the ground and into the atmosphere, further worsening global warming. Researchers have found that rising temperatures can lead to population booms in soil microbes, which quickly exhaust easily digestible carbon compounds. This forces the organisms to turn to older, more resilient carbon stores, converting carbon stored away long ago into carbon dioxide.
With the combined threat of rising temperatures and damage to soil microbe communities from intensive farming and disappearing forests, some computer models indicate that 40 percent less carbon will stick in the soil by 2100 than previous simulations have anticipated (SN: 9/22/16).
To see if scientists can coax soils to store more carbon, researchers need to understand what makes soil microbes tick. But that is no simple task. “Some say soil is the most complex matrix on the planet,” says Kirsten Hofmockel, an ecologist at the Pacific Northwest National Laboratory in Richland, Wash., who was not involved in the research.
To simplify matters, Domeignoz-Horta, of the University of Zurich, and colleagues grew their own dirt in the lab. The researchers separated fungi and bacteria from forest soil and grew five combinations of these communities in petri dishes, including some that were home only to bacteria or fungi. The researchers sustained the microbes on a diet of simple sugar and left them to churn out soil for four months. The team then heated the different soils to see how much carbon dioxide was produced.
Bacteria were the main drivers behind making soil, but fungi-rich soils produced less carbon dioxide when heated than soils made solely by bacteria, the researchers found. Why is still unclear. One possibility is that fungi could be producing enzymes — proteins that build or break up other molecules — that bacteria aren’t capable of making on their own, Domeignoz-Horta says. These fungi-derived compounds may provide bacteria with different building blocks with which to build soil, which may end up creating carbon compounds with a longer shelf life in soils.
What happens in lab-grown soil may not play out the same in the real world. But the new research is an important step in understanding how carbon is locked away long-term, Hofmockel says. This kind of information could one day help researchers develop techniques to ensure that more carbon stays in the ground for longer, which could help mitigate the amount of carbon dioxide in the atmosphere.
“If we can get carbon in the ground for five years, that’s a step in the right direction,” Hofmockel says. “But if we can have stable carbon in the soil for centuries or even millennia, that’s a solution.”
Defining the role of associate producer can be a little bit challenging, especially at a show like Radiolab, where every member of staff is a jack of all trades. Additionally, I was brought in “temporary,” a contract hire to help exclusively with the new mini-series Mixtape, hosted by Simon Adler. As half of a two-person team, […]
The post What In The World Does An AP Actually Do? appeared first on Transom.
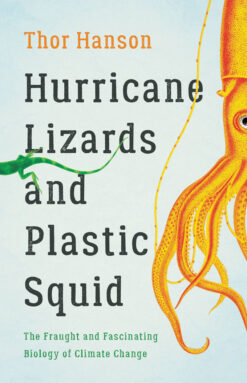
Hurricane Lizards and Plastic Squid
Thor Hanson
Basic Books, $28
As a conservation biologist, Thor Hanson has seen firsthand the effects of climate change on plants and animals in the wild: the green macaws of Central America migrating along with their food sources, the brown bears of Alaska fattening up on early-ripening berry crops, the conifers of New England seeking refuge from vanishing habitats. And as an engaging author who has celebrated the wonders of nature in books about feathers, seeds, forests and bees (SN: 7/21/18, p. 28), he’s an ideal guide to a topic that might otherwise send readers down a well of despair.
Hanson does not despair in his latest book, Hurricane Lizards and Plastic Squid. Though he outlines the many ways that global warming is changing life on our planet, his tone is not one of hand-wringing. Instead, Hanson invites the reader into the stories of particular people, places and creatures of all sorts. He draws these tales from his own experiences and those of other scientists, combining reporting with narrative tales of species that serve as examples of broader trends in the natural world.
A trip to La Selva Biological Station in Costa Rica, for example, has Hanson reliving the experience of tropical ecologist and climatologist Leslie Holdridge, who founded the research station in the 1950s and described, among other things, how climate creates different habitats, or life zones, as elevation increases. As Hanson sweats his way up a tropical mountainside so he can witness a shift in life zones, he notes, “I had to earn every foot of elevation gain the hard way.” I could almost feel the heat that he describes as “a steaming towel draped over my head.” His vivid descriptions bring home the reason why so many species have now been documented moving upslope to cooler climes.
Hanson doesn’t waste much breath trying to convince doubters of the reality of climate change, instead showing by example after example how it is already playing out. The book moves quickly from the basic science of climate change to the challenges and opportunities that species face — from shifts in seasonal timing to ocean acidification — and the ways that species are responding.
As Hanson notes, the acronym MAD, for “move, adapt or die,” is often used to describe species’ options for responding. But that pithy phrase doesn’t capture the complexity of the situation. For instance, one of his titular characters, a lizard slammed by back-to-back Caribbean hurricanes in 2017, illustrates a different response. Instead of individual lizards adjusting, or adapting, to increasingly stormy conditions, the species evolved through natural selection. Biologists monitoring the lizards on two islands noticed that after the hurricanes, the lizard populations had longer front legs, shorter back legs and grippier toe pads on average than they had before. An experiment with a leaf blower showed that these traits help the lizards cling to branches better — survival of the fittest in action.
In the end, the outcomes for species will probably be as varied as their circumstances. Some organisms have already moved, adapted or died as a result of the warming, and many more will face challenges from changes that are yet to come. But Hanson hasn’t given up hope. When it comes to preventing the worst-case scenarios, he quotes ecologist Gordon Orians, who is in the seventh decade of a career witnessing environmental change. When asked what a concerned citizen should do to combat climate change, he responded succinctly: “Everything you can.” And as Hanson points out, this is exactly how plants and animals are responding to climate change: by doing everything they can. The challenge feels overwhelming, and as a single concerned citizen, much feels out of my hands. Yet Hanson’s words did inspire me to take a cue from the rest of the species on this warming world to do what I can.
Buy Hurricane Lizards and Plastic Squid from Bookshop.org. Science News is a Bookshop.org affiliate and will earn a commission on purchases made from links in this article.
Cat Jaffee is clear. Podcasting is not about talking into a mic. It’s about listening. Cat’s a firm believer in “a better world through better listening,” as she puts it. As a podcaster, she feels the best content is derived from listening. Cat is the founder and director of House of Pod, a community podcasting […]
The post House of Pod Closes the House appeared first on Transom.
As the United States is poised to roll out its Covid-19 vaccine booster program for all adults, misleading information on social media around this latest development is likely to become the focal point of the next round of vaccine misinformation.
Already, false narratives about additional vaccine shots creating a new wave of infections and newer variants of the coronavirus elsewhere in the world have resurfaced. For example, Robert Malone, a Covid-19 vaccine skeptic known for his role in contributing to the development of mRNA vaccine technology but has since been promoting claims of the vaccine causing miscarriage, the vaccine not being authorized and other false information, is a major promoter. Malone, who has a sizeable audience through Twitter and his amplifiers in the right-wing media ecosystem, has posted multiple tweets in the past few days describing the vaccine as “leaky”.
Other pandemic skeptics and vaccine deniers used the rise of case numbers in Western Europe, where many countries had already given out extra doses, as purported “proof” of booster shots leading to new and more infections. Some social media posts pointed to Gibraltar, the highly vaccinated British territory that just announced a new round of Covid-19 restriction measures because of increasing infection numbers.
A blog post by an anti-vaccine Substack user popular among like-minded social media users claimed that neighbouring countries where booster shots have not yet begun or kicked into high gear had less of a spike in cases than Gibraltar. It was retweeted by Jeffrey A. Tucker, a libertarian writer and president of the Brownstone Institute, a newly founded publication that has been promoting ivermectin, hydroxychloroquine and other unproven Covid-19 “cures.” — Keenan Chen
The post Misinformation accompanies US expansion of boosters appeared first on First Draft.
False comparisons have again been drawn between Nazi Germany and Covid-19 pandemic measures, this time prompted by the introduction of a lockdown for people in Austria who are not fully vaccinated.
About two million people in Austria, or one-third of the population, were placed in lockdown on Monday, November 15, with the country facing a surge of infections. Austria has one of the lowest vaccination rates in Western Europe, with anti-vaccine sentiment encouraged by the far-right opposition Freedom Party.
In the hours after the announcement of the lockdown, the following statements were made in the Facebook comment sections of Australian news publishers with millions of followers, on subreddits with millions of members, and in Australian Telegram groups with thousands of members.
There were many references to Austria as Adolf Hitler’s birthplace and the rise of Hitler’s Nazi Party in Germany, with comments claiming history was repeating itself.
Others commenters falsely claimed unvaccinated people would be sent to “camps”, “rounded up” and vaccinated, or forced to wear signs like yellow stars, as Jewish people were forced to under Nazi rule. Some referred to “the Final Solution” when discussing the lockdown, while others made antisemitic statements and claimed the lockdown was a sign that Austria is embracing fascism.
Comments that misconstrued the role of vaccines and therefore the relevance of the lockdown were common. Some falsely stated that the vaccines don’t work and that unvaccinated people were being blamed for rising case numbers. Research shows that vaccinated people are less likely to contract and spread Covid-19, and less likely to require hospitalization.
There were misleading attempts to link Austria’s lockdown with pandemic measures in Australia, such as claiming that Victoria’s controversial pandemic laws would give the state’s premier power to implement a similar lockdown. The false claim was also made that Australia is building camps for the unvaccinated, as debunked by AAP Fact Check here.
As previously reported by First Draft, opposition movements to Covid-19 vaccination and other public health measures have frequently sought to link aspects of the pandemic with Nazi indoctrination and policies. These types of comparisons are unfounded and irrelevant: Jewish people and others, including Romani and gay people, were persecuted and killed based on ethnicity and sexuality. — Lucinda Beaman
The post Austria’s lockdown for unvaccinated people falsely compared to Nazi policies appeared first on First Draft.
It’s hard to imagine what Earth might look like in 2500. But a collaboration between science and art is offering an unsettling window into how ongoing climate change might transform now-familiar terrain into alien landscapes over the next few centuries.
These visualizations — of U.S. Midwestern farms overtaken by subtropical plants, of a dried-up Amazon rainforest, of extreme heat baking the Indian subcontinent — emphasize why researchers need to push climate projections long past the customary benchmark of 2100, environmental social scientist Christopher Lyon and colleagues contend September 24 in Global Change Biology.
Fifty years have passed since the first climate projections, which set that distant target at 2100, says Lyon, of McGill University in Montreal. But that date isn’t so far off anymore, and the effects of greenhouse gas emissions emitted in the past and present will linger for centuries (SN: 8/9/21).
To visualize what that future world might look like, the researchers considered three possible climate trajectories — low, moderate and high emissions as used in past reports by the United Nations’ Intergovernmental Panel on Climate Change — and projected changes all the way out to 2500 (SN: 1/7/20). The team focused particularly on impacts on civilization: heat stress, failing crops and changes in land use and vegetation (SN: 3/13/17).
For all but the lowest-emission scenario, which is roughly in line with limiting global warming to “well under” 2 degrees Celsius relative to preindustrial times as approved by the 2015 Paris Agreement, the average global temperature continues to increase until 2500, the team found (SN: 12/12/15). For the highest-emissions scenario, temperatures increase by about 2.2 degrees C by 2100 and by about 4.6 degrees C by 2500. That results in “major restructuring of the world’s biomes,” the researchers say: loss of most of the Amazon rainforest, poleward shifts in crops and unlivable temperatures in the tropics.
The team then collaborated with James McKay, an artist and science communicator at the University of Leeds in England, to bring the data to life. Based on the study’s projections, McKay created a series of detailed paintings representing different global landscapes now and in 2500.
The team stopped short of trying to speculate on future technologies or cities to keep the paintings based more in realism than science fiction, Lyon says. “But we did want to showcase things people would recognize: drones, robotics, hybrid plants.” In one painting of India in 2500, a person is wearing a sealed suit and helmet, a type of garment that people in some high-heat environments might wear today, he says.
The goal of these images is to help people visualize the future in such a way that it feels more urgent, real and close — and, perhaps, to offer a bit of hope that humans can still adapt. “If we’re changing on a planetary scale, we need to think about this problem as a planetary civilization,” Lyon says. “We wanted to show that, despite the climate people have moved into, people have figured out ways to exist in the climate.”
High greenhouse gas emissions could increase average global temperatures by about 4.6 degrees Celsius relative to preindustrial times. As a result, extreme heat in India could dramatically alter how humans live in the environment. Farmers and herders, shown in 2000 the painting at left, may require protective clothing such as a cooling suit and helmet to work outdoors by 2500, as shown in the painting at right.


If greenhouse gas emissions remain high, the U.S. Midwest’s “breadbasket” farms, as seen below in 2000 in the painting at left, could be transformed into subtropical agroforestry regions by 2500, researchers say. The region might be dotted with some versions of oil palms and succulents, as envisioned in the painting at right, and rely on water capture and irrigation devices to offset extreme summer heat.


Over decades, centuries and millennia, the steady skyward climb of redwoods, the tangled march of mangroves along tropical coasts and the slow submersion of carbon-rich soil in peatlands has locked away billions of tons of carbon.
If these natural vaults get busted open, through deforestation or dredging of swamplands, it would take centuries before those redwoods or mangroves could grow back to their former fullness and reclaim all that carbon. Such carbon is “irrecoverable” on the timescale — decades, not centuries — needed to avoid the worst impacts of climate change, and keeping it locked away is crucial.
Now, through a new mapping project, scientists have estimated how much irrecoverable carbon resides in peatlands, mangroves, forests and elsewhere around the globe — and which areas need protection.
The new estimate puts the total amount of irrecoverable carbon at 139 gigatons, researchers report November 18 in Nature Sustainability. That’s equivalent to about 15 years of human carbon dioxide emissions at current levels. And if all that carbon were released, it’s almost certainly enough to push the planet past 1.5 degrees Celsius of warming above preindustrial levels.
“This is the carbon we must protect to avert climate catastrophe,” says Monica Noon, an environmental data scientist at Conservation International in Arlington, Va. Current efforts to keep global warming below the ambitious target of 1.5 degrees C require that we reach net-zero emissions by 2050, and that carbon stored in nature stays put (SN:12/17/18). But agriculture and other development pressures threaten some of these carbon stores.
To map this at-risk carbon, Noon and her colleagues combined satellite data with estimates of how much total carbon is stored in ecosystems vulnerable to human incursion. The researchers excluded areas like permafrost, which stores lots of carbon but isn’t likely to be developed (although it’s thawing due to warming), as well as tree plantations, which have already been altered (SN: 9/25/19). The researchers then calculated how much carbon would get released from land conversions, such as clearing a forest for farmland.
That land might store varying amounts of carbon, depending on whether it becomes a palm oil plantation or a parking lot. To simplify, the researchers assumed cleared land was left alone, with saplings free to grow where giants once stood. That allowed the researchers to estimate how long it might take for the released carbon to be reintegrated into the land. Much of that carbon would remain in the air by 2050, the team reports, as many of these ecosystems take centuries to return to their former glory, rendering it irrecoverable on a timescale that matters for addressing climate change.
Researchers mapped the location and density of Earth’s irrecoverable carbon — carbon locked in ecosystems that is potentially vulnerable to release from human development and, if lost, could not be restored to those ecosystems by 2050. Areas of exceptionally high density of irrecoverable carbon (purple) include the Pacific Northwest, the Amazon, the Congo Basin and Borneo.
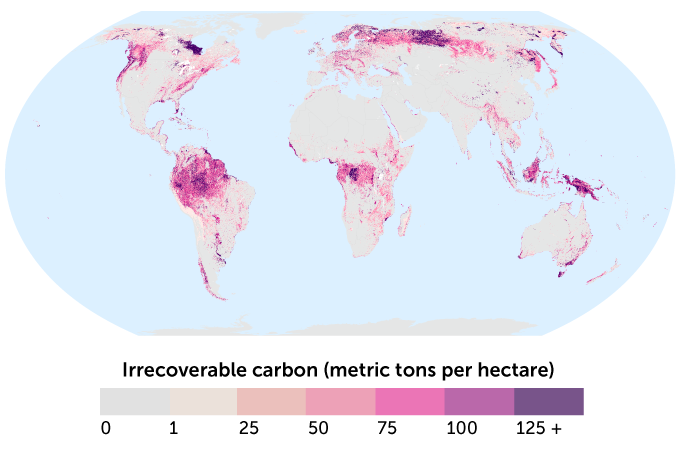
Releasing that 139 gigatons of irrecoverable carbon could have irrevocable consequences. For comparison, the United Nations’ Intergovernmental Panel on Climate Change estimates that humans can emit only 109 more gigatons of carbon to have a two-thirds chance of keeping global warming below 1.5 degrees C. “These are the places we absolutely have to protect,” Noon says.
Approximately half of this irrecoverable carbon sits on just 3.3 percent of Earth’s total land area, equivalent to roughly the area of India and Mexico combined. Key areas are in the Amazon, the Pacific Northwest, and the tropical forests and mangroves of Borneo. “The fact that it’s so concentrated means we can protect it,” Noon says.
Roughly half of irrecoverable carbon already falls within existing protected areas or lands managed by Indigenous peoples. Adding an additional 8 million square kilometers of protected area, which is only about 5.4 percent of the planet’s land surface, would bring 75 percent of this carbon under some form of protection, Noon says.
“It’s really important to have spatially explicit maps of where these irrecoverable carbon stocks are,” says Kate Dooley, a geographer at the University of Melbourne in Australia who wasn’t involved in the study. “It’s a small percentage globally, but it’s still a lot of land.” Many of these dense stores are in places at high risk of development, she says.
“It’s so hard to stop this drive of deforestation,” she says, but these maps will help focus the efforts of governments, civil society groups and academics on the places that matter most for the climate.
When North Carolina residents Susan McGuirk and her husband bought a holiday house on a large waterfront plot in Wingate, in Maryland’s Dorchester County, the stately old home hadn’t been occupied for more than a decade.
“We pulled into the driveway and it was love at first sight,” she said. “Once inside, it was obvious just how well built the house was.”
|
This is the third story in “Life on the Edge,” a series of journalism and research initiatives at Climate Central examining wetlands, sea-level rise and coastal change with support from the Doris Duke Charitable Foundation. This story was produced and published through partnership with the Chesapeake Bay Magazine. |
Since then, they’ve sealed up the original wavy glass windows, fixed walls, installed insulation and new plumbing and wiring, and raised the entire waterfront property to protect against regular flooding. And as they’ve rehabilitated what McGuirk called a “gem,” they’ve watched the coastal landscape around it change as well.
“The point that we can see when we look out there is called Crab Point, and when we bought the place in 2010 there were 80 trees on that point,” McGuirk said. “Now there’s one. They’ve fallen and gone.”
The Chesapeake has become a global hotspot for the emergence of ghost forests—stands of dead and leafless trees before they topple into piles of logs. Within the Chesapeake, Dorchester County may be the greatest hotspot of all.
Throughout the rural and forested land that surrounds their house, Susan points out “acres and acres” of dead trees. “There’s a little church called Emmanuel Episcopal Church, and it is surrounded by all those dead trees.”
The culprit of arboreal mortality tends to be environmental change. In Colorado, ghost forests are being created by beetles attacking pines at higher altitudes as temperatures warm. In California, forest overcrowding from a century of wildfire suppression followed by severe drought left more than 100 million trees dead.
Here, the key culprit is salt, which can kill a tree outright or make it more susceptible to attacks by pests.
Global sea rise caused by heat-trapping pollution and a gradual sinking of the land around the Chesapeake have combined to create some of the world’s fastest local rates of sea rise. That’s been pushing saltwater higher up shorelines, where it’s seeping into sweeping stretches of intact forest and killing them off.

The McGuirks’ home in Wingate, Md. (Jay Fleming)
McGuirk hasn’t been able to figure out the exact age of the house, but she said local oral history suggests it was built well over a century ago. Data gathered by scientists at the Virginia Institute of Marine Sciences (VIMS) indicate the property would have been dry back then, most likely covered with forest or farmland.
Now, the house is surrounded by lawn, mud and marsh, and the land is regularly covered by water spilling up from an estuary. “When everything is aligned—a full moon, easterly winds, high tide—it gets pretty dicey,” McGuirk said.
The appearance of these assemblages of towering deadwood along the Mid-Atlantic and Gulf coasts have captured the fascination of national media outlets, which point to them in photo essays as flamboyant evidence of the grim reality of climate change.
The natural sinking of the land following the prehistoric retreat of glaciers from North America is also driving up water levels throughout the region, compounding the briny impacts of climate change. And as the forests die back, their roots decompose, lowering the ground further still.
As coastal woodlands die, birds and other wildlife that had depended upon them for food and habitat are forced inland. The changes are also affecting parcels of land that in some instances have been owned by the same families for hundreds of years.
“As we start to lose forests, these landowners are losing their identity—they’re losing how they can use the land,” said Matthew Hurd, a forester with the Maryland Forest Service.
“For me there’s a huge mental shift between someone who owns a forest and manages it versus someone who has marsh.”
Coastal timberlands and farmlands are losing value as salt continues its upward march. Rising sea levels can have corrosive effects on the fertility of coastal lands, with knockout punches often delivered by storm surges that leave large doses of salt behind as they subside.
Coastal ecologists point out that the ghost forests of the Chesapeake don’t represent local ecological carnage, so much as a transformation from one ecosystem to another. Beneath the desiccating branches of dead trees, marshland is seizing the soggy land from forests that can’t abide the soil’s new chemistry.
To survive as seas rise, marshes can grow vertically—though only up to a point before they get swamped. They can also migrate inland, conquering areas that formerly harbored forests, farms, and yards. Experts point to ghost forests as visually arresting indicators of marsh migration.
Marshes provide critical habitat for fish and ducks. They also offer powerful natural protections for coastal communities and infrastructure from flooding during storms. More than half of wetlands nationwide are estimated to have been destroyed by development and other forces, though they remain widespread in relatively undeveloped places like Dorchester County.
With few roads or buildings blocking their migration, research by Climate Central’s sea level scientists has indicated marshes could expand their territory in Dorchester County by more than a third from 2000 to 2050. Other Eastern Shore counties are projected to see even bigger expansions of marshland.
The new marshes aren’t perfect replicas of the old ones. An invasive variety of Phragmites (aka reeds) tends to beat native marshland species into new areas as trees start to die back and the forest canopy opens up.
The reeds’ feathery plumes can tower on rigid stems over a dozen feet. Native wildlife struggle to use the Phragmites for nesting and foraging, compared with native plants.

Remains of trees show the damage from saltwater intrusion (Jay Fleming)
“We’re seeing a real expansion of that species as the forest retreats,” said Keryn Gedan, a biologist at George Washington University. “We think it just does better in the shady conditions than the native grass marshes. It’s the first one to take advantage of the increasing light availability.”
Matt Kirwan, a marsh scientist at VIMS, began investigating the emergence of ghost forests in 2000 as an undergraduate student. His research has found that 80,000 acres of forestland and 20,000 acres of farmland have transformed to marshland since the 1850s across the Chesapeake Bay.
“We’re right at the edge of a live forest and a dead forest,” he said on a hot late morning in early June as he bushwhacked through dying coastal forest near the Moneystump Swamp in the Blackwater National Wildlife Refuge, about 20 miles north of McGuirk’s vacation home.
Kirwan was there leading a team of scientists from his lab on a weeklong fieldwork campaign as they gathered data from sites from Virginia to Delaware. The fieldwork was part of a multiyear effort to monitor physical and chemical changes as coastal forestland succumbs to marshland.
Research by Kirwan’s and other labs is helping to predict the emergence of ghost forests. This could help avoid costly efforts to protect and restore forests that are doomed to die.
“This was our transition zone plot, which was supposed to have 50 percent living and 50 percent dead trees,” he said, pointing around at an abundance of dead snags. “We established it last year and I would say there’s nowhere close to 50 percent living trees right now.”
A few hundred feet further inland, while talking in the cool shade of a large pine, Kirwan said the tree overhead might look healthy, but that it was already destined to be killed by the rising concentrations of salt in the soil beneath it.
“The little stuff dies before the big stuff,” Kirwan said. “You’ll see lots of healthy-looking pine trees but then you look below you and there’s nothing in the understory to take their place. So the forest, even though it looks healthy, it’s already effectively dead. Whenever those large trees die, it’ll only be marsh.”
Aaron Smale (Ngāti Porou), Host, Researcher, Co-writer: Lake Alice has been on a shortlist of stories I’ve wanted to tell in an expansive way for several years. I’d been researching state institutions that had held children in the late 20th century in New Zealand and Lake Alice always stood out. It wasn’t only the abuse, which […]
It started with polar bears.
In 2012, polar bear DNA revealed that the iconic species had faced extinction before, likely during a warm period 130,000 years ago, but had rebounded. For researchers, the discovery led to one burning question: Could polar bears make a comeback again?
Studies like this one have emboldened an ambitious plan to create a refuge where Arctic, ice-dependent species, from polar bears down to microbes, could hunker down and wait out climate change. For this, conservationists are pinning their hopes on a region in the Arctic dubbed the Last Ice Area — where ice that persists all summer long will survive the longest in a warming world.
Here, the Arctic will take its last stand. But how long the Last Ice Area will hold on to its summer sea ice remains unclear. A computer simulation released in September predicts that the Last Ice Area could retain its summer sea ice indefinitely if emissions from fossil fuels don’t warm the planet more than 2 degrees Celsius above preindustrial levels, which is the goal set by the 2015 Paris Climate Agreement (SN: 12/12/15). But a recent report by the United Nations found that the climate is set to warm 2.7 degrees Celsius by 2100 under current pledges to reduce emissions, spelling the end of the Arctic’s summer sea ice (SN: 10/26/21).
Nevertheless, some scientists are hoping that humankind will rally to curb emissions and implement technology to capture carbon and other greenhouse gases, which could reduce, or even reverse, the effects of climate change on sea ice. In the meantime, the Last Ice Area could buy ice-dependent species time in the race against extinction, acting as a sanctuary where they can survive climate change, and maybe one day, make their comeback.
The Last Ice Area is a vast floating landscape of solid ice extending from the northern coast of Greenland to Canada’s Banks Island in the west. This region, roughly the length of the West Coast of the United States, is home to the oldest and thickest ice in the Arctic, thanks to an archipelago of islands in Canada’s far north that prevents sea ice from drifting south and melting in the Atlantic.
As sea ice from others part of the Arctic rams into this natural barrier, it piles up, forming long towering ice ridges that run for kilometers across the frozen landscape. From above, the area appears desolate. “It’s a pretty quiet place,” says Robert Newton, an oceanographer at Columbia University and coauthor of the recent sea ice model, published September 2 in Earth’s Future. “A lot of the life is on the bottom of the ice.”
The muddy underbelly of icebergs is home to plankton and single-celled algae that evolved to grow directly on ice. These species form the backbone of an ecosystem that feeds everything from tiny crustaceans all the way up to beluga whales, ringed seals and polar bears.
These plankton and algae species can’t survive without ice. So as summer sea ice disappears across the Arctic, the foundation of this ecosystem is literally melting away. “Much of the habitat Arctic species depend on will become uninhabitable,” says Brandon Laforest, an Arctic expert at World Wildlife Fund Canada in Montreal. “There is nowhere else for these species to go. They’re literally being squeezed into the Last Ice Area.”

The last stronghold of summer ice provides an opportunity to create a floating sanctuary —an Arctic ark if you will — for the polar bears and many other species that depend on summer ice to survive. For over a decade, WWF Canada and a coalition of researchers and Indigenous communities have lobbied for the area to be protected from another threat: development by industries that may be interested in the region’s oil and mineral resources.
“The tragedy would be if we had an area where these animals could survive this bottleneck, but they don’t because it’s been developed commercially,” Newton says.
But for Laforest, protecting the Last Ice Area is not only a question of safeguarding arctic creatures. Sea ice is also an important tool in climate regulation, as the white surface reflects sunlight back into space, helping to cool the planet. In a vicious cycle, losing sea ice helps speed up warming, which in turn melts more ice.
And for the people who call the Arctic home, sea ice is crucial for food security, transportation and cultural survival, wrote Inuit Circumpolar Council Chair Okalik Eegeesiak in a 2017 article for the United Nations. “Our entire cultures and identity are based on free movement on land, sea ice and the Arctic Ocean,” Eegeesiak wrote. “Our highway is sea ice.”
The efforts of these groups have borne some fruit. In 2019, the Canadian government moved to set aside nearly a third of the Last Ice Area as protected spaces called marine preserves. Until 2024, all commercial activity within the boundaries of the preserves is forbidden, with provisions for Indigenous peoples. Conservationists are now asking these marine preserves to be put under permanent protection.
However, there are some troubling signs that the sea ice in the region is already precarious. Most worrisome was the appearance in May 2020 of a Rhode Island—sized rift in the ice at the heart of the Last Ice Area. Kent Moore, a geophysicist at the University of Toronto, says that these unusual events may become more frequent as the ice thins. This suggests that the Last Ice Area may not be as resilient as we thought, he says.
This is something that worries Laforest. He and others are skeptical that reversing climate change and repopulating the Arctic with ice-dependent species will be possible. “I would love to live in a world where we eventually reverse warming and promote sea ice regeneration,” he says. “But stabilization seems like a daunting task on its own.”
Still, hope remains. “All the models show that if you were to bring temperatures back down, sea ice will revert to its historical pattern within several years,” says Newton.
To save the last sea ice — and the creatures that depend on it — removing greenhouse gases from the atmosphere will be essential, says oceanographer Stephanie Pfirman of Arizona State University in Tempe, who coauthored the study on sea ice with Newton. Technology to capture carbon, and prevent more carbon from entering the atmosphere, already exists. The largest carbon capture plant is in Iceland, but projects like that one have yet to be implemented on a major scale.
Without such intervention, the Arctic is set to lose the last of its summer ice before the end of the century. It would mean the end of life on the ice. But Pfirman, who suggested making the Last Ice Area a World Heritage Site in 2008, says that humankind has undergone big economic and social changes — like the kind needed to reduce emissions and prevent warming — in the past. “I was in Germany when the [Berlin] wall came down, and people hadn’t expected that to happen,” she says.
Protecting the Last Ice Area is about buying time to protect sea ice and species, says Pfirman. The longer we can hold on to summer sea ice, she says, the better chance we have at bringing arctic species —from plankton to polar bears — back from the brink.
In a remote corner of Brazil’s Amazon rainforest, researchers have spent decades catching and measuring birds in a large swath of forest unmarred by roads or deforestation. An exemplar of the Amazon’s dazzling diversity, the experimental plot was to act as a baseline that would reveal how habitat fragmentation, from logging or roads, can hollow out rainforests’ wild menagerie.
But in this pristine pocket of wilderness, a more subtle shift is happening: The birds are shrinking.
Over 40 years, dozens of Amazonian bird species have declined in mass. Many species have lost nearly 2 percent of their average body weight each decade, researchers report November 12 in Science Advances. What’s more, some species have grown longer wings. The changes coincide with a hotter, more variable climate, which could put a premium on leaner, more efficient bodies that help birds stay cool, the researchers say.
“Climate change isn’t something of the future. It’s happening now and has been happening and has effects we haven’t thought of,” says Ben Winger, an ornithologist at the University of Michigan in Ann Arbor who wasn’t involved in the research but has documented similar shrinkage in migratory birds. Seeing the same patterns in so many bird species across widely different contexts “speaks to a more universal phenomenon,” he says.
Biologists have long linked body size and temperature. In colder climates, it pays to be big because having a smaller surface area relative to one’s volume reduces heat loss through the skin and keeps the body warmer. As the climate warms, “you’d expect shrinking body sizes to help organisms off-load heat better,” says Vitek Jirinec, an ecologist at the Integral Ecology Research Center in Blue Lake, Calif.
Many species of North American migratory birds are getting smaller, Winger and colleagues reported in 2020 in Ecology Letters. Climate change is the likely culprit, Winger says, but since migrators experience a wide range of conditions while globe-trotting, other factors such as degraded habitats that birds may encounter can’t be ruled out.
To see if birds that stay put have also been shrinking, Jirinec and colleagues analyzed data on nonmigratory birds collected from 1979 to 2019 in an intact region of the Amazon that spans 43 kilometers. The dataset includes measurements such as mass and wing length for over 11,000 individual birds of 77 species. The researchers also examined climate data for the region.
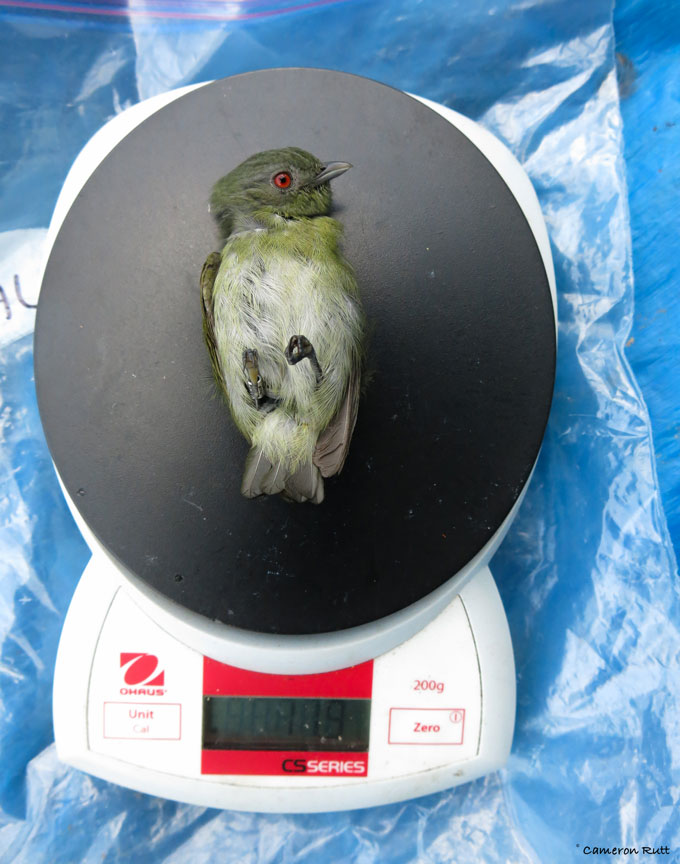
All species declined in mass over this period, the researchers found, including birds as different as the Rufous-capped antthrush (Formicarius colma), which snatches insects off the forest floor, and the Amazonian motmot (Momotus momota), which scarfs down fruit up in trees. Species lost from about 0.1 percent to nearly 2 percent of their average body weight each decade. The motmot, for example, shrunk from 133 grams to about 127 grams over the study period.
These changes coincided with an overall increase in the average temperature of 1 degree Celsius in the wet season and 1.65 degrees C in the dry season. Temperature and precipitation also became more variable over the time period, and these short-term fluctuations, such as an especially hot or dry season, better explained the size trends than the steady increase in temperature.
“The dry season is really stressful for birds,” Jirinec says. Birds’ mass decreased the most in the year or two after especially hot and dry spells, which tracks with the idea that birds are getting smaller to deal with heat stress.
Other factors, like decreased food availability, could also lead to smaller sizes. But since birds with widely different diets all declined in mass, a more pervasive force like climate change is the likely cause, Jirinec says.
Wing length also grew for 61 species, with a maximum increase of about 1 percent per decade. Jirinec thinks that longer wings make for more efficient, and thus cooler, fliers. For instance, a fighter jet, with its heavy body and compact wings, takes enormous power to maneuver. A light and long-winged glider, by contrast, can cruise along much more efficiently.
“Longer wings may be helping [birds] fly more efficiently and produce less metabolic heat,” which can be beneficial in hotter conditions, he says. “But that’s just a hypothesis.” This body change was most pronounced in birds that spend their time higher up in the canopy, where conditions are hotter and drier than the forest floor.
Whether these changes in shape and size represent an evolutionary adaptation to climate change, or simply a physiological response to warmer temperatures, remains unclear (SN: 5/8/20). Whichever is the case, Jirinec suggests that the change shows the pernicious power of human activity (SN: 10/26/21).
“The Amazon rainforest is mysterious, remote and teeming with biodiversity,” he says. “This study suggests that even in places like this, far removed from civilization, you can see signatures of climate change.”
Vaccine misinformation concerning the coronavirus spike protein has again picked up in recent days. Vaccine skeptics and deniers have weaponized this medical term to deter people from trusting Covid-19 vaccines, which have been proven effective and safe.
Natural News, InfoWars and other well-known disinformation actors intentionally misinterpreted a recently published paper on a potential mechanism of how full-length spike protein found on the coronavirus could diminish a person’s DNA repair system — especially in older people — and obstruct their adaptive immunity. Yet these disinformation actors baselessly claimed the vaccine itself sends spike protein into a recipient’s “cell nuclei” and “suppresses DNA repair engine.” This narrative is misleading because “mRNA never enters the nucleus of the cell where our DNA (genetic material) is located, so it cannot change or influence our genes,” reads a CDC fact sheet.
A recent Wall Street Journal report on scientists looking into how the mRNA-based vaccines could trigger myocarditis, pericarditis or other heart inflammation symptoms in a small number of recipients also drew attention from vaccine and pandemic skeptics. One of the many theories researchers are considering, according to the report, is the possibility that the spike protein, which is produced by the body after receiving the vaccine, might share similarities with ones found in the heart muscle, tricking the immune system into attacking the heart muscle. Still, recent studies have confirmed these cases to be extremely rare and mostly benign.
Additionally, an FDA document on recommending the vaccine for children ages 5-11 was taken out of context by these actors to justify their anti-vaccination stance. While experts with the FDA theorized a scenario where, if Covid-19 transmission were low, the number of “myocarditis-related hospitalizations in boys in this age group would be slightly more than Covid-related hospitalizations,” they still confirm the benefits of vaccination outweighing concerns about side effects. Yet some highly engaged social media posts misleadingly claim that the government has admitted there will be more myocarditis hospitalizations than those for coronavirus. — Keenan Chen
The post Disinformation actors share misconstrued narratives about coronavirus spike protein to push vaccine skepticism appeared first on First Draft.
Last week Pfizer published interim trial results for its experimental Covid-19 antiviral pill, Paxlovid, which the company said reduced the chance of hospitalization or death for some adults by almost 90 per cent. The US pharmaceutical giant’s analysis included 1,219 adults who had been diagnosed with mild to moderate Covid-19 and who had at least one risk factor for developing severe disease.
First Draft examined Facebook posts by Australian news publishers covering this story and found that misinformation and misunderstandings flourished in the comment sections, with potential audiences in the hundreds of thousands over the past week.
Facebook users questioned the efficacy and relevance of Covid-19 vaccines in light of the emergence of the antiviral pill, questioning the need for the pill if the vaccine is effective. Others shared the misleading claim that the Covid-19 vaccines are as not effective as reported if a pill could cure the disease or alleviate the condition. While the antiviral pill may be helpful for those diagnosed with Covid-19, vaccines reduce a person’s chances of contracting it.
Many commenters incorrectly drew links with the anti-parasitic medication ivermectin, describing the Pfizer antiviral treatment as “Ivermectin renamed,” “like ivermectin but more expensive” and “Pfizermectin.” The comment sections became a forum for the misleading promotion of ivermectin as a “safe and effective,” “tried and tested” and “successful” treatment for Covid-19.
The antiviral pill and ivermectin are not the same. The WHO recommends against using ivermectin in patients with Covid-19, except in the context of a clinical trial. Misinformation around ivermectin as a Covid-19 treatment has led to real-world harm.
Negative sentiments about profits to be made from the medication were also common, with comments speculating this is a new stream of revenue for Pfizer after making the vaccines.
First Draft reported on similar narratives circulating in October after the Merck antiviral pill molnupiravir was approved in the UK. Explainer stories and prebunks addressing the respective roles of Covid-19 vaccines and treatments could prevent data deficits that lead to the spread of misinformation.
Discussions taking place in comment sections have the potential to shape attitudes and behaviors. Previous First Draft research has highlighted a need for greater content moderation by publishers as well as the gap between Facebook’s misinformation policies and actual outcomes. — Lucinda Beaman
The post Facebook comment sections rife with misinformation following Pfizer’s Covid-19 antiviral pill announcement appeared first on First Draft.
Welcome back to Starting Out! My friends in high school were pretty competitive. Every quarter, the class rankings would come out and we’d silently note which friends were ahead of us in GPA. Everyone humble bragged about their AP classes and extracurriculars. Maybe you had a similar experience. When the stakes feel so high (“get […]
The post Starting Out: Issue 4 appeared first on Transom.
By John Upton, Climate Central and Maanvi Singh, The Guardian

The Dixie fire ranked as the second-largest California wildfire on record - surpassed only by the million-acre-plus August Complex fire of 2020. Photograph: David Swanson/Reuters
|
This story was produced through a partnership between The Guardian and Climate Central. |
On late summer and autumn days, when the hot, howling winds sting the skin and chap the lips, Holly Fisher starts to feel a bit unsettled. So do many of her neighbors in the town of Paradise, a name that evokes bitter irony in northern California.
“It feels eerie,” she said. Three years ago, this arid, blustery weather portended the Camp fire. It consumed the town, killed more than 80 people, and burned down Fisher’s home. As the region reeled in the aftermath, the same potent convergence of weather conditions – known as “fire weather” – helped fuel the North Complex fire in 2019, and the Caldor and Dixie fires this year.
Across the Sierra Nevada foothills, fire weather is increasingly becoming a distressing reality of life. Over the last half-century, global heating has dramatically increased the number of annual fire-weather days in the region, a Climate Central analysis of federal weather station data shows.
The Climate Central research reveals that the number of annual fire-weather days in what the National Oceanic & Atmospheric Administration (Noaa) defines as the Sacramento Drainage climate division climbed from an average of seven days in the early 1970s to 22 in 2020. This year there were 25.

The number of fire weather days has jumped from seven in the early 1970s to 25 in 2021.
Analysis of weather station and fire data also indicates that after the Dixie fire erupted in mid-July this year, nine of the ten days in which it grew the most explosively were characterized by fire weather conditions. The blaze tore through 1m acres of forest and razed much of the city of Greenville.
The new analysis found that a similar trend is bearing out across much of the US west. From the Pacific coast to the Great Plains, the number of fire-weather days is increasing. In some regions, fire weather has come to characterize nearly a quarter of the year.
The findings are consistent with a growing body of research suggesting that California is entering an unprecedented new era of fire. Climate scientists have found that in parts of the state, fall fire-weather days are expected to double by the end of the century. California’s fire season, which has historically peaked in the late summer and autumn, has been expanding.
“Stringing together many extreme fire-weather days in a row allows fire sizes to quickly escalate,” said John Abatzoglou, a climate and fire scientist at the University of California, Merced, who advised the Climate Central analysis and co-authored the research regarding fall fire weather.
“We used to have a lot more regional fire hotspots and now those hotspots are growing. It’s a contagion and that is certainly compromising our ability to manage fire,” said Abatzoglou, adding that the changes are creating “synchronous” fire risks across the region– and the world – making it more difficult for governments and agencies to backstop one another with firefighters and equipment.
What is a fire-weather day?Based on the approach taken by federal storm forecasters at NOAA, Climate Central characterized a fire-weather day as one when, for two consecutive hours within the same day, the temperature reached at least 40F (5C) in winter, 50F (10C) in the summer or 45F (7.2C) during spring and autumn; when winds blew at sustained intensities of at least 15 mph; and when relative humidity neared thresholds adopted by storm forecasters in various regions. During peak fire season, relative humidity in many parts of the west dip to single digits. |
Characterization of fire weather by Climate Central.
On days with fire weather, a small spark could ignite a megafire in a landscape that has been primed to burn by decades of prolonged drought.
The combination of rising temperatures and low humidity also sucks moisture out of the soil, further allowing flames to zip across forests and towns, uninhibited by moisture.
“Everything is so dry that as soon as you blow one of those embers out of the existing fire perimeter, things just catch like that,” said Karen McKinnon, a scientist at the University of California, Los Angeles, who studies climate breakdown and destructive weather.

Global heating and build-up of flammable vegetation have contributed to the increase in wildfires.
McKinnon’s research has examined the role of climate change in driving dryer conditions that are leading to the increase in the recent fire weather, but she pointed out that “it’s not just related to climate”.
In northern California, fires like the Dixie fire have been further fueled by massive build-ups of vegetation – which has accumulated on the landscape during a century of aggressive fire suppression.
“I’m always feeling like a sitting duck,” said Trina Cunningham, the executive director of the Maidu Summit Consortium, who saw a tribal health center, the homes of several members, and a 2,325-acre expanse of culturally important land burn up in the Dixie fire. “The velocity of the fire was just mind-boggling,” said Cunningham. “I couldn’t even comprehend it.”
Her two sons, who work for local fire crews, narrowly escaped the blaze as it bore down on the town of Greenville and surrounding areas where many Maidu tribal members lived. As she watched the wind pick up, her eldest reported that he was safe – but the crew’s truck and equipment were destroyed.

As drought and fire weather simultaneously overtake regions across California and the west, fire crews have been strained and short-staffed.
By then, Cunningham had begun frantically making calls, appealing to local fire chiefs and the Bureau of Indian Affairs to send more firefighters to the region. “I kept asking – we need help, we need support,” she said. Eventually, a small crew did arrive – but thousands of acres had already burned.
“It’s been really frustrating to have to sit there and watch year after year of neglect take its toll,” she said. “We need to start tending to our landscape as we tend to our gardens.”
For Cunningham, the comment is more than metaphor. For centuries before European colonization, California Indians kept forest fuel loads under control by using what foresters now call “prescribed burns”. Today many critics say the practice is underutilized. To reduce the fire risks wrought by the increase in fire weather, experts have for years been calling on western states and the federal government to radically boost the use of prescribed fire to clear would-be fuel from forests.
With extreme fire weather in the mix, firefighters can no longer expect cooler, more humid night conditions to help them tamp down big blazes. As drought and fire weather simultaneously overtake regions across California and the west, fire crews have been strained and short-staffed.
“A lot of us here had come to dread summers, because we know that there’s always a potential for a crazy fire season,” Cunningham said. In the aftermath, “there’s been so much fear, anger, trauma – and just sheer exhaustion”.
Californians have had to cope with a seemingly nonstop cycle of disasters in recent years. But the expanding season and growing intensity of wildfires creates a new level of anxiety, according to David Baron, a neuropsychiatrist at the Western University of Health Sciences in Southern California.
“In California you learn, ‘Yeah, earthquakes can come, the big one might come,’ but you almost tend to deny it to some degree,” said Baron. “Fire is a different story because every fire season they’re getting worse and worse.”
Climate Central’s analysis shows that nearly the entire state appears to have been affected by more frequent fire weather, though no data is available for a narrow band of the state’s north-eastern corner. Other states are also seeing stark changes. In parts of New Mexico, Texas, Oregon and Washington, fire weather is at least twice as prevalent as it was 50 years ago.
To combat the increase in fire weather, there’s scientific consensus that the global economy must be flipped from reliance on polluting fossil fuels to 21st-century technologies. For example, local electrical grids powered by solar and wind energy, augmented by battery storage, produce negligible carbon pollution, and they reduce threats from long-distance transmission lines, which have sparked some of California’s deadliest and most destructive fires.
“I don’t think that these big wildfires are going to stop until something really gives,” said Fisher. Paradise is unlikely to burn again in the near future – there’s not much left to burn. “But I worry for other communities, about who’s going to be next.”
Download a transcript of this episode here. Take a look at the photo above, the two strips of film from the collection at the Imperial War Museum in London. They document the sound of Armistice Day, the end of World War I, and the silencing of artillery. On the left, the war at full tilt a minute […]
The post A Sonic Conjuring (Rerun) appeared first on Transom.
Several videos of anti-vaccine medical workers recording themselves being suspended or fired from their jobs at healthcare facilities have generated significant interest in the past few days.
Most physicians and healthcare workers in the United States have received Covid-19 vaccines. In a June survey, the American Medical Association reported that 96 percent of physicians have been fully vaccinated against Covid-19. And in earlier surveys of thousands of members, the American Nurses Association and the American Association of Nurse Practitioners reported that most of their members had received the vaccines.
In one video, which had been viewed over 7 million times on Twitter before the account was suspended, a San Diego-area nurse filmed herself being escorted out of a medical facility after refusing to take the Covid-19 vaccine for religious reasons. The nurse told a San Diego television station she believed her “God-given immune system” was good enough to fight Covid-19. In addition to its spread on social media and amplification by influencers, the video also received coverage from news organizations and digital outlets such as The New York Post, The Daily Mail, Newsday and the right-wing One America News Network.
Similarly, in another video, a healthcare worker at a Los Angeles hospital was escorted out for his refusal to receive what he called “the experimental vaccine,” a long-lasting misinformation narrative. The video, shared by a Facebook Page based in South Africa, has received at least 3.5 million views since last weekend. These viral videos once again show how misleading claims from healthcare workers — even if they have no training in epidemiology or vaccine science — can resonate because due to their profession, they are perceived as experts. — Keenan Chen
The post Videos of anti-vaccine healthcare workers being removed from jobs reinforce misleading claims appeared first on First Draft.
Australia will begin offering Covid-19 vaccine booster shots to eligible members of its adult population on November 8. News that the country’s medicines regulator, the Therapeutic Goods Administration (TGA), had provisionally approved the Pfizer vaccine as a third dose was met with skepticism, misinformation and conspiracy theories online. Shared as posts and comments on Facebook, Instagram and Twitter accounts in Australia, these narratives had potential audiences in the hundreds of thousands in the past week.
Some social media users suggested the need for Covid-19 booster shots means previous vaccination efforts have failed. For example, on an Instagram post by the TGA, one commenter asked whether the approval of boosters means the TGA is admitting the two doses are ineffective. On Facebook, a Queensland-based nutritionist made the misleading claim that “the earlier shots haven’t truly worked.” On Facebook and Instagram, comments on articles posted by news organizations included similar questions and statements.
Conspiracy theories that Australian politicians, the TGA and US pharmaceutical companies are recommending booster shots for financial gain were common, including claims of “kickbacks,” “political bribes,” scams and profiteering. Some of these themes were also shared in cartoons and memes.
Many of the examples feed into a broader false narrative that Covid-19 vaccines don’t work or are unnecessary. The misleading claims were spreading on social media shortly after the government announcements, and it was clear there were data deficits regarding the recommendation for booster shots.
It would be helpful for media organizations and other communicators to pair news stories with explainers that address people’s potential questions and concerns around Covid-19 vaccines — in this case, why additional doses may be necessary. — Lucinda Beaman
The post Boost in vaccine misinformation and conspiracy theories as Australia prepares to roll out Pfizer booster for adults appeared first on First Draft.
Global temperatures are rising and so, it seems, is part of the sky.
Atmosphere readings collected by weather balloons in the Northern Hemisphere over the last 40 years reveal that climate change is pushing the upper boundary of the troposphere — the slice of sky closest to the ground — steadily upward at a rate of 50 to 60 meters per decade, researchers report November 5 in Science Advances.
Temperature is the driving force behind this change, says Jane Liu, an environmental scientist at the University of Toronto. The troposphere varies in height around the world, reaching as high as 20 kilometers in the tropics and as low as seven kilometers near the poles. During the year, the upper boundary of the troposphere — called the tropopause — naturally rises and falls with the seasons as air expands in the heat and contracts in the cold. But as greenhouse gases trap more and more heat in the atmosphere, the troposphere is expanding higher into the atmosphere (SN: 10/26/21).
Liu and her colleagues found that the tropopause rose an average of about 200 meters in height from 1980 to 2020. Nearly all weather occurs in the troposphere, but it’s unlikely that this shift will have on a big effect on weather, the researchers say. Still, this research is an important reminder of the impact of climate change on our world, Liu says.
“We see signs of global warming around us, in retreating glaciers and rising sea levels,” she says. “Now, we see it in the height of the troposphere.”
By Ayurella Horn-Muller (Climate Central), Brendan Rivers (ADAPT) and Danielle Uliano (WJXT)
At the height of the COVID-19 pandemic and during the ensuing economic slowdown, Jacksonville virtually shut down. Businesses shuttered their doors and most who were able to started working from home. That meant far fewer internal combustion engine vehicles were being driven, leading to massive reductions in air pollution and noticeably cleaner air.
|
This feature story and radio and television segments were produced through a collaboration with News4Jax WJXT Channel 4 and ADAPT from WJCT Public Media. Click here for local reporting tools and suggestions. |
“There was definitely less traffic,” said Veronica Glover, a lifelong resident of Jacksonville’s Urban Core and the executive director of the Sister Hermana Foundation, a non-profit that helps families fighting cancer. The only time Glover noticed any serious traffic was during the food giveaway events that she helped organize or at COVID-19 testing sites across the city.

Veronica Glover, left, and her mother Carolyn Myers, right. Credit: Veronica Glover
What Glover witnessed was happening all across the globe, but as people and industries returned to their routine use of cars and trucks, air quality worsened again. That’s because the largest contributor to carbon emissions in the U.S. is transportation — contributing to 29% of national emissions. And 76% of emissions in the transportation sector come from the fossil fuel-burning engines in our cars, trains, trucks and buses.
Electric vehicles present a solution for reducing this substantial share of harmful pollutants. Experts say electrification of trucks and cars would be an essential step toward canceling out America’s yearly greenhouse gas emissions by 2050. Often called “net zero,” such an elimination of heat-trapping emissions would also require deep investments in solar and wind generation and battery storage, possibly nuclear power, and an overhaul of transmission lines nationally.
Princeton University’s Net Zero America program has been researching scenarios that could see the U.S. reach net zero by 2050. Under a scenario with an aggressive approach to electrifying vehicles, one that would see sales of electric vehicles outnumber sales of gas guzzlers within a decade, they estimate Florida could avoid nearly 10,000 premature deaths by 2050 caused by diseases from tailpipe pollution.

The benefits wouldn’t just be felt in frontline communities like Glover’s. Air quality across the entire state would improve if internal combustion engines were replaced with electric vehicles.
Putting all those electric vehicles on the roads would mean more than just building and buying them, though. A raft of infrastructure overhauls would be required, including scaling up installation of chargers and changes to utilities’ electrical transmission strategies.
Florida officials last year prepared a roadmap that could help the state achieve such a daunting task. The plan included everything from adapting transportation infrastructure to advancing electrified mobility and electrifying disaster preparedness.
The Republican-controlled legislature passed its first piece of climate legislation in 2020. With the next legislative session beginning in January, Advanced Energy Economy policy lead and Clermont City Councilman Ebo Entsuah is paying close attention to what policymakers bring forward.
“Especially in a state where we do see a number of natural disasters, it’ll be important for our legislators to get together and put out some of these recommendations from the floor, from the electric vehicle roadmap,” Entsuah said.

Traffic heading towards downtown Jacksonville. Credit: Sharkshock, Shutterstock
Florida has the third-highest number of new EV charging stations added between 2017 and 2021, behind California and New York. At 58,160, Florida also has the second highest number of registered EVs in the country.
Dory Larsen, the Electric Transportation Program Manager for the Southern Alliance for Clean Energy, says thanks to booming EV sales, utility investment and charging deployment, Florida is poised to lead the EV market across the Southeast. To meet that demand, an additional economic boost could come from EV manufacturing in the state, she says.
“We found that in Florida, if all of the cars, trucks, and buses were electric today, Florida would have an extra $12.5 billion circulating through the state’s economy, annually,” said Larsen. A SACE report found that in 2019, the state and consumers spent $27.6 billion on gas and diesel, while fully electric transportation would have cost only $17.2 billion.
The time it takes to move from combustion engines to electric motors will have a significant effect on curbing overall greenhouse gas emissions. EVs would need to dominate American auto sales by the end of this decade for the U.S. to successfully decarbonize by 2050, helping it meet the goals of the Paris Climate Agreement and avoid the most catastrophic potential levels of climate change.
The federal administration is taking steps toward net zero planning as President Biden has called for 50% of passenger vehicle and light truck sales in 2030 to be zero-emission vehicles. On Thursday, the federal administration released the newest framework of their $1.75 trillion Build Back Better plan, which it is trying to push through Congress.
The new framework includes a $555 billion commitment to curbing carbon emissions, with a focus on making clean energy cheaper through tax credits. The legislation also specifies electrifying transit systems to improve air quality, reducing consumer costs of EVs manufactured in the U.S. and directing clean energy jobs towards lower-income communities.

An electric vehicle at a charging station. Credit: Bill Bortzfield, WJCT News
Convincing drivers to switch technologies for the sake of air quality could be a tough proposition. Fleet purchasers wield a lot more consumer influence, and the rental car industry will play a critical role in the widespread adoption of electric vehicles. Tesla’s new $4.2 billion deal with Hertz signals a shift in the way the rental car industry is responding to consumers’ growing sustainability demands.
For individual consumers, fuel savings can be a draw, helping to start to replace some of the internal combustion engines on the roads with cleaner-running electric vehicles.
Electric vehicle fueling costs per household can be 50% to 75% lower than for gasoline-fueled vehicles. A 2020 U.S. Department of Energy study found that in Florida, an EV driver’s lifetime fuel costs are an average $7,000 cheaper than for drivers of fossil-fueled vehicles.
That cost-effectiveness is what won Jacksonville resident Erik Gonzalez over. “After having done some research into EVs, and Tesla in particular, I was really just impressed by not just the performance aspect, but the reliability and the cost of maintenance,” he said.
Gonzalez just invested in his first Tesla. He gets about 285 miles out of a full charge and has driven about 6,000 miles. “That equates to a cost savings of about $1,100 so far, just in fuel savings,” he said. Gonzalez also recently signed up for a new incentive program for EV owners that JEA launched in October.
The rebate can shave nearly $100 a year off the electric bill and offset some of the cost of installing an electric charger.
“This is a win-win for the utility and for the EV owners that get approximately 2,000 miles of free driving every year they enroll in the program,” said Dave McKee, JEA’s program manager of electrification.
Gonzalez is one of hundreds who have signed up for the rebate, which is part of JEA’s larger Drive Electric program. JEA and the federal government also offer incentives for individuals and companies that want to install electric vehicle charging stations, on top of up to a $7,500 federal tax credit for buying new electric and hybrid vehicles.
Many Jacksonville residents considering EVs may also be concerned about what their city utility’s energy mix means for their personal carbon footprint. JEA is still very dependent on fossil fuels. Last year the utility got just 1% of its energy from renewable sources and this year is expected to be very similar.
JEA, however, has a stated goal of getting 30% of its energy from carbon-neutral sources by the end of this decade. It’s working through the logistics of how to get there.

JEA’s downtown Jacksonville headquarters. Credit: Bill Bortzfield, WJCT News
“We are going to know more, probably, in a year and half to say what our forward plan is, and we’ll have a much better understanding of how renewables play into our mix,” said Vicki Nichols, JEA director of customer solutions, market and development.
Jacksonville is not unique. Electric vehicles still only make up 1% of passenger cars worldwide, but many of the world’s biggest automakers are investing in manufacturing EVs, from Ford to Toyota to Volkswagen, in a range of price points and styles.
JEA is also working with Jacksonville car dealers on educating shoppers about the benefits of electric vehicles, including at Tom Bush Volkswagen in Arlington.
“Volkswagen’s really getting into electric vehicles in a big way. They’re developing a whole fleet of charging stations across the country, and they just launched the ID.4 this last spring, and it’s selling so well. We’re really excited about this vehicle,” said Megan Del Pizzo, vice president of Tom Bush Volkswagen.
In addition to price, one of the most common concerns Del Pizzo and her colleagues hear from customers interested in EVs has to do with finding charging stations. According to Del Pizzo, that’s pretty much a non-issue in the River City.
“The amount of chargers we have in Jacksonville now, you really don’t need the range anxiety that a lot of people have when they’re driving an electric car, because there are chargers everywhere: at dealerships, workplaces, at the (St. Johns) Town Center,” she said.
Duval’s high ratio of charging stations per driver is due, in part, to a relatively low number of EV vehicles on Jacksonville’s roads.
“We benefited from entities like Town Center mall coming out with large charging banks… but less than 1% of our market right now is EVs,” said Nichols with JEA. “But a year from now, who knows? We may be behind. So we’re committed to keeping up with the market.”
As EVs grow in popularity, gas stations throughout Jacksonville and elsewhere could install charging stations to benefit from the transition to a majority electric transportation sector. But a new Florida law, signed by Gov. Ron DeSantis in June, prohibits local officials from requiring gas stations to install electric vehicle chargers.
“It really is taking the power out of the hands of the municipalities and the counties and preventing them from hitting those 100% clean energy goals,” said Ebo Entsuah, the state policy lead at AEE. State legislators’ shying away from clean-energy legislation and gas industries’ lobbying against local sustainable policies doesn’t help. “It definitely can stall a bit,” Entsuah said.

Trachea transplant recipient Sonia Sein talks with the lead surgeon of her procedure, Dr. Eric Genden, left, during a checkup visit. Credit: Marshall Ritzel, AP Photo
Exposure to air pollution increases the chance that people will end up in the hospital, and if they have respiratory or cardiovascular diseases like COPD, stroke, lung cancer or asthma, it lowers their chance of surviving them. That means where you live within Jacksonville can actually be a matter of life and death.
“In low and middle income areas of cities, where historically, highways and roads tend to have been built in… in those areas where there’s a lot more car traffic and transportation traffic, we see a higher increased risk or higher increased prevalence of these diseases,” said Scott Helgeson, a pulmonologist at Jacksonville’s Mayo Clinic.
Air pollution disproportionately affects those living near busy freeways and congested roadways, in neighborhoods that typically have larger portions of Black and Latinx residents, partly because of racist historical housing practices such as redlining. These frontline communities also tend to live close to power plants or other industrial facilities, which compounds the poor air quality.
“There’s a triple burden,” said Marianne Hatzopoulou, a professor in engineering at the University of Toronto and head of the school’s transportation and air quality research group. “Not only are disadvantaged populations experiencing the highest levels of air pollution, but they are also the ones that are generating the least amount of emissions from transportation in a day,” she said.
Hatzopoulou says a growing body of evidence linking air pollution exposure to social disadvantage should be taken into account when local and state governments evaluate transportation decisions.
“What we want is the benefits of these policies to actually accrue to the people who are exposed to the highest level of air pollution,” Hatzopoulou said.
For nearly two years, researchers tracked air quality disparities between low-income neighborhoods of color and high-income white neighborhoods in Jacksonville and more than 50 other U.S. cities. The recently published study, co-authored by University of Virginia atmospheric chemist Sally Pusede, focused on levels of NO2, or nitrogen dioxide — an air pollutant released from fossil fuels that can cause and exacerbate chronic health problems like asthma.
In Jacksonville, people of color living in low-income neighborhoods breathe air containing nearly a quarter more NO2 than non-Hispanic whites living in high-income areas.
That same study also compared diesel NO2 emissions on weekends with weekdays, finding that a drop in heavy trucking on weekends led to pollution cuts of more than 60% on average, with frontline communities benefiting the most.
“This is another piece of evidence that says to policymakers that these trucks are really important, to control the emissions of diesel trucks,” said Pusede. “People should be paying attention to the equity dimensions of these vehicles. That is the most important part.”
Throughout her life, Jacksonville resident Veronica Glover has had to watch her friends and family suffer through terrible illnesses. Her mother has COPD and is a breast cancer survivor, her husband died from colon cancer and her grandmother died from lung cancer. Glover, who herself is a breast cancer survivor, worries that pollution from vehicles and industrial sources is contributing to the prevalence of these diseases in her neighborhood just northeast of Downtown.
“Inhaling that same type of toxin over and over and over again is definitely not good for our community,” she said. While Glover tries to help residents deal with the effects of pollution, she hopes city leaders and other policymakers start pursuing electrification strategies that will help communities like hers breathe cleaner air.
“It would definitely impact and increase our numbers, in saving lives,” she said.
News headlines about a UK-based Australian actress who suffered a stroke “after getting Covid vaccine” or “after getting the AstraZeneca Covid vaccine” overly emphasized a single incident without providing important context about the rarity of such reaction. The family of actress Melle Stewart, who had a stroke two weeks after her first dose of the AstraZeneca vaccine in early June, said on a GoFundMe page that she was diagnosed with vaccine-induced Thrombocytopenic Thrombosis (VITT), or Thrombosis with thrombocytopenia syndrome (TTS). Despite her misfortune, the family added that VITT is a “very rare side effect of this particular vaccine” and that Stewart “has been and continues to be an advocate for vaccination”.
Without including statistics to illustrate the unlikely event of VITT, or TTS, following the AstraZeneca vaccine, these headlines risk exaggerating the probability of people who are otherwise healthy and relatively young like Stewart developing serious health issues after their vaccination. According to Australia’s medicines watchdog the Therapeutic Goods Administration (TGA), as of October 21 “there have been 156 cases of TTS assessed as related to Vaxzevria (AstraZeneca) from approximately 12.6 million vaccine doses”.
British far-right activist Stephen Yaxley-Lennon, who goes by Tommy Robinson, recently called the Australian government “totalitarian” over the country’s Covid-19 restrictions and lockdown policy. Robinson shared a link to a Daily Mail report about Melle Stewart on Telegram saying severe reactions to Covid-19 vaccines are not as rare as reported. The post has been viewed over 35,000 times after being shared by Robinson with his 137,000 followers.
Australian celebrity chef and conspiracy theorist Pete Evans, who is followed by nearly 50,000 users on Telegram, reposted a post from a popular conspiracy-fueled website that focused on the presumed and unproven correlation that since Stewart was healthy, her stroke would have been caused by the vaccine.
A post in a Telegram channel dedicated to anti-lockdown protests falsely stated that the AstraZeneca vaccine would cause stroke. While clots in the arteries following vaccination can cause stroke, the probability for AstraZeneca recipients to develop VITT or TTS is extremely rare. The TGA also said the risk of TTS is not likely to be increased in people with a history of ischaemic heart disease or stroke.
News reports about the reactions well-known figures such as celebrities and influencers have following vaccination can unwittingly be used as a powerful vector in promoting false information and conspiracy theories, as First Draft pointed out in a campaign against “misinfluencers”. An iInaccurate, and in this case distasteful, comparison by Australian actress Nikki Osborne between a purported workplace vaccine mandate and a meme showing Harvey Weinstein’s pursuit of actress Lindasy Lohan can work to vilify Covid-19 vaccines and hamper the government’s vaccination efforts. — Esther Chan
The post Headlines about Australian actress’s stroke after vaccination fail to mention rarity of the conditions appeared first on First Draft.
This year was supposed to be a turning point in addressing climate change. But the world’s nations are failing to meet the moment, states a new report by the United Nations Environment Programme.
The Emissions Gap Report 2021: The Heat Is On, released October 26, reveals that current pledges to reduce greenhouse gas emissions and rein in global warming still put the world on track to warm by 2.7 degrees Celsius above preindustrial levels by the end of the century.
Aiming for “net-zero emissions” by midcentury — a goal recently announced by China, the United States and other countries, but without clear plans on how to do so — could reduce that warming to 2.2 degrees C. But that still falls short of the mark, U.N. officials stated at a news event for the report’s release.
At a landmark meeting in Paris in 2015, 195 nations pledged to eventually reduce their emissions enough to hold global warming to well below 2 degrees C by 2100 (SN: 12/12/15). Restricting global warming further, to just 1.5 degrees C, would forestall many more devastating consequences of climate change, as the Intergovernmental Panel on Climate Change, or IPCC, reported in 2018 (SN: 12/17/18). In its latest report, released in August, the IPCC noted that extreme weather events, exacerbated by human-caused climate change, now occur in every part of the planet — and warned that the window to reverse some of these effects is closing (SN: 8/9/21).
Despite these dire warnings, “the parties to the Paris Agreement are utterly failing to keep [its] target in reach,” said U.N. Secretary-General António Guterres. “The era of half measures and hollow promises must end.”
The new U.N. report comes at a crucial time, just days before world leaders meet for the 2021 U.N. Climate Change Conference, or COP26, in Glasgow, Scotland. The COP26 meeting — postponed from 2020 to 2021 due to the COVID-19 pandemic — holds particular significance because it is the first COP meeting since the 2015 agreement in which signatories are expected to significantly ramp up their emissions reductions pledges.
The U.N. Environment Programme has kept annual tabs on the still-yawning gap between existing national pledges to reduce emissions and the Paris Agreement target (SN: 11/26/19). Ahead of the COP26 meeting, 120 countries, responsible for emitting just over half of the world’s greenhouse gas emissions, announced their new commitments to address climate change by 2030.
The 2021 report finds that new commitments bring the world only slightly closer to where emissions need to be by 2030 to reach warming targets. With the new pledges, total annual emissions in 2030 would be 7.5 percent lower (about 55 gigatons of carbon dioxide equivalent) than they would have been with pledges as of last year (about 59 gigatons). But to stay on track for 2 degrees C of warming, emissions would have to be about 30 percent lower than the new pledges, or about 39 gigatons each year. To hold warming to 1.5 degrees C requires a roughly 55 percent drop in emissions compared with the latest pledges, to about 25 gigatons a year.
“I’m hoping that the collision of the science and the statistics in the gap analysis, and the voices of the people will promote a greater sense of urgency,” says Gabriel Filippelli, a geochemist at Indiana University–Purdue University Indianapolis.
On October 26, Filippelli, the editor of the American Geophysical Union journal GeoHealth, and editors in chief of other journals published by the organization coauthored a statement in Geophysical Research Letters. Theyurged world leaders at COP26 to keep the “devastating impacts” of climate change in check by immediately reducing global carbon emissions and shifting to a green economy. “We are scientists, but we also have families and loved ones alongside our fellow citizens on this planet,” the letter states. “The time to bridge the divide between scientist and citizen, head and heart, is now.”
Publishing that plea was a departure for some of the scientists, Filippelli says. “We have been publishing papers for the last 20 to 30 years, documenting the train wreck of climate change,” he says. “As you can imagine, behind the scenes there were some people who were a little uncomfortable because it veered away from the true science. But ultimately, we felt it was more powerful to write a true statement that showed our hearts.”
Download a transcript of this episode here. I can’t tell you how many times people have told me with disdain “I’m sick of how formulaic podcasts have become.” This lament probably started two or three years ago, maybe a little longer. And, it’s continued to build over time. The complaint is that they’re formulaic in […]
The post The World Orchestra Is Always Playing appeared first on Transom.
A reluctant manifesto for the best computers of this moment The most perfect anything I have ever owned is a 2004 PowerBook G4. Its entire chassis is machined from brushed aluminum; even the keyboard is metal, giving each key the perfect key travel, providing the perfect clack. It still feels like it’s from the future, […]
The post Back To Windows appeared first on Transom.
Welcome back to Starting Out, from Transom and me! If this is the first issue you’re reading, I’m Alice, a podcast producer and reporter. In the past few months, a lot of my friends have quit their jobs. Hell, I even did it recently. After pretty relentless work over the past year and a half, […]
The post Starting Out: Issue 3 appeared first on Transom.
The amount of sunlight that Earth reflects back into space — measured by the dim glow seen on the dark portions of a crescent moon’s face — has decreased measurably in recent years. Whether the decline in earthshine is a short-term blip or yet another ominous sign for Earth’s climate is up in the air, scientists suggest.
Our planet, on average, typically reflects about 30 percent of the sunlight that shines on it. But a new analysis bolsters previous studies suggesting that Earth’s reflectance has been declining in recent years, says Philip Goode, an astrophysicist at Big Bear Solar Observatory in California. From 1998 to 2017, Earth’s reflectance declined about 0.5 percent, the team reported in the Sept. 8 Geophysical Research Letters.
Using ground-based instruments at Big Bear, Goode and his colleagues measured earthshine — the light that reflects off our planet, to the moon and then back to Earth — from 1998 to 2017. Because earthshine is most easily gauged when the moon is a slim crescent and the weather is clear, the team collected a mere 801 data points during those 20 years, Goode and his colleagues report.
Much of the decrease in reflectance occurred during the last three years of the two-decade period the team studied, Goode says. Previous analyses of satellite data, he and his colleagues note, hint that the drop in reflectance stems from warmer temperatures along the Pacific coasts of North and South America, which in turn reduced low-altitude cloud cover and exposed the underlying, much darker and less reflective seas.
“Whether or not this is a long-term trend [in Earth’s reflectance] is yet to be seen,” says Edward Schwieterman, a planetary scientist at University of California, Riverside, who was not involved in the new analysis. “This strengthens the argument for collecting more data,” he says.
Decreased cloudiness over the eastern Pacific isn’t the only thing trimming Earth’s reflectance, or albedo, says Shiv Priyam Raghuraman, an atmospheric scientist at Princeton University. Many studies point to a long-term decline in sea ice (especially in the Arctic), ice on land, and tiny pollutants called aerosols — all of which scatter sunlight back into space to cool Earth.
With ice cover declining, Earth is absorbing more radiation. The extra radiation absorbed by Earth in recent decades goes toward warming the oceans and melting more ice, which can contribute to even more warming via a vicious feedback loop, says Schwieterman.
Altogether, Goode and his colleagues estimate, the decline in Earth’s reflectance from 1998 to 2017 means that each square meter of our planet’s surface is absorbing, on average, an extra 0.5 watts of energy. For comparison, the researchers note in their study, planet-warming greenhouse gases and other human activity over the same period boosted energy input to Earth’s surface by an estimated 0.6 watts of energy per square meter. That means the decline in Earth’s reflectance has, over that 20-year period, almost doubled the warming effect our planet experienced.
Last year, during the pandemic, Ruby Schwartz says she was questioning everything about her identity and whether she should be an audio producer and reporter. On top of that, she was wrestling with a creative lull. Again, it was the pandemic. Anxiety and desolation was in the air. Seemed like everyone was feeling emotionally beat […]
The post From Memoir to Radio Story appeared first on Transom.
New Climate Central research shows that under the current emissions pathway leading toward 3°C global warming, about 50 major cities around the world will need to mount globally unprecedented defenses or lose most of their populated areas to unremitting sea level rise lasting hundreds of years but set in motion by pollution this century and earlier.
We have the opportunity now to change this future. Meeting the most ambitious goals of the Paris Climate Agreement will likely reduce exposure by roughly half, allowing nations to avoid building untested defenses or abandoning many coastal megacities.
|
Related Resources |
Climate Central’s scientists examined where populations are most vulnerable within the next 200 to 2000 years and under different scenarios of warming. The results are alarming:
Written in collaboration with researchers at Princeton University and the Potsdam Institute for Climate Impact Research in Germany, Climate Central’s peer-reviewed research paper focuses on the contrast between 4°C and 2°C warming scenarios, and appears in the scientific journal Environmental Research Letters. This summary report instead focuses on the contrast between 3°C and 1.5°C scenarios, which correspond to continuing the current trajectory vs. making deep and immediate cuts to climate pollution, dropping to roughly half of today’s annual emissions by 2030.
The peer-reviewed research has enabled Climate Central to develop a number of powerful visual tools to communicate the future risks of warming and to show what we can save.
Figure 1. Sapporo, Japan: Projected Future Sea Levels
Utilizing Google Earth images, Climate Central developed realistic renderings of coastal locations under different future warming scenarios. Through the Picturing Our Future interface, users can select from among hundreds of images of at-risk sites around the world, including financial centers, stadiums, museums, temples and churches, and other historically or culturally significant buildings. Each image allows toggling between a number of scenarios. Users can look at current conditions and compare where water levels could end up after 1.5°C of warming (if we implement measures to sharply cut carbon pollution) up to 4°C (if we allow unchecked carbon pollution).
Figure 2. Bangkok, Thailand: Coastal Risk Screening Tool

Climate Central’s updated mapping tool allows users to compare sea level projections after different temperature increases, highlighting the areas that could be saved by reducing our carbon pollution and limiting global warming. Users can enter nearly any global coastal address or location to see where land is projected to be below the high tide line. Sliders allow users to see the projected effects set by different amounts of global warming, from 1.0°C to 4.0°C and can choose between roadmap and satellite settings.
Figure 3. Dhaka, Bangladesh: Projected Future Sea Levels
Climate Central worked with visual artist Nickolay Lamm to create photorealistic illustrations of the multi-century sea level rise consequences of 1.5°C and 3°C of warming at a number of iconic locations identified as vulnerable in the research.
Figure 4. Glasgow, United Kingdom: Projected Future Sea Levels

We have created fly-over videos contrasting the projected future sea levels after 1.5°C vs. 3°C of global warming in many coastal cities around the world where 3-D building data is currently available in Google Earth.
As detailed in the newly published peer-reviewed research, these findings are based on localized long-term sea level projections published in the Proceedings of the National Academy of Sciences of the United States of America (Strauss et al. 2015), overlain against the AI-based coastal elevation dataset CoastalDEM version 1.1 (Kulp and Strauss 2018) and 100-meter-resolution global population density data from WorldPop. Exposure estimates were aggregated to city level using urban agglomeration boundary data from Natural Earth, and aggregated to national level using administrative boundary data from GADM 2.0.
Each year since 2015, Science News has featured the work of outstanding early- and mid-career scientists in our SN 10: Scientists to Watch list. They’re nominated by Nobel laureates and members of the National Academy of Sciences, and are recognized because of their curiosity, passion, determination and, of course, their discoveries.
But we decided that 2021 begs for something different. The coronavirus pandemic continues to rage worldwide, with its burdens falling hardest on those least able to bear them — inequities already on our minds due to Black Lives Matter, #MeToo and other social movements. At the same time, we’re learning that the window to reverse some of climate change’s most devastating effects is closing fast. With all the upheaval, we wondered: How do these extraordinary times change a scientist’s work?
Here, we catch up with 10 noteworthy Scientists to Watch alumni. Emily Fischer, who studies wildfire smoke, has faced the threat of fires firsthand, cognitive neuroscientist Jessica Cantlon is fighting sexual harassment in the sciences and economist Parag Pathak is taking his efforts to make institutions more equitable from schools to hospitals. Other scientists reveal how their work has gained new urgency and meaning for them. The interviews that follow have been edited for length and clarity.
— Elizabeth Quill







Cognitive neuroscientist
Carnegie Mellon University
Jessica Cantlon, featured in 2016, studies the evolution and development of complex mathematical thinking, including the traits that set humans apart from other primates. In 2017, she was recognized as a Time Person of the Year, as a “silence breaker” speaking out against sexual harassment during the height of the #MeToo movement.
We’ve expanded our repertoire to compare people across different cultures, who have different educational practices. We’ve been going to Bolivia to work with this group of people called the Tsimane, who live in rural parts of the Amazon forest. They don’t have the rigid, formal schooling where kids go through these particular curricula to achieve mathematical cognition. Instead, education there is more organic and more deeply connected to their way of life. That allows us to try to understand what effect does a particular type of education have on numerical thinking.
There was one study that we did, comparing species — nonhuman primates and humans — to understand the evolution of these concepts. Across all species and stages of development and cultural groups, there’s this bias that when you’re looking at a set of objects, and you’re trying to quantify it, you think about that set numerically. And you don’t have to; you can think about that set of objects spatially, as an amount of stuff, you can think about how much surface area is there, or the perimeter around it. But primates, including humans, [tend to] think about that set as a set of discrete objects, and count them up.
We’ve looked at the similarities and differences between boys and girls as their brains develop. We’ve done some of the first, early studies comparing children’s brains that can truly allow us to collect evidence on the trajectory of similarity between boys and girls…. We’ve shown that very early in development, between around 3 and 8 years of age, there’s evidence during mathematical processing that most of the brain — over 95 percent — shows functional similarity in that processing between boys and girls.
But as we know, much later on in development, we see a severe underrepresentation of girls in mathematics-related fields. What’s happening? There’s evidence in the field … that what happens in late childhood and adolescence is that children’s interests are shaped culturally.
In 2016, [some of my colleagues at the University of Rochester and I] filed a sexual harassment complaint against a faculty member in our department who was sexually harassing women — undergraduate and graduate students and faculty. It became this situation that hijacked my career for a number of years.… We went public with our complaint, partly to protect ourselves, but also partly to let people know at other universities that this kind of thing is happening to students, and it’s affecting women’s career paths in ways that are discriminatory and unequal.
Ultimately, it was really important. Our complaint went public in September of 2017. In October 2017, the Harvey Weinstein story came out in the New York Times, and that kicked off a series of reactions that ultimately culminated in millions of people saying #MeToo, which I think was really powerful and important, and was something that we got to be a part of.
I’ve had dozens of women reach out to me for advice, about how to file a complaint at their university, how to take legal action, if that’s what they’re thinking, what the risks and benefits are. And so, part of my career now — and I’m excited by it, and I think it’s really important work — is to be an advocate for women who are experiencing discrimination and harassment at universities.
One response that we thought was really great was that the National Academies of Sciences, Engineering and Medicine did a full study on sexual harassment in the sciences…. It has a lot of ideas about what might effect larger-scale change.
— Interview by Aina Abell
Economist
MIT
Parag Pathak, featured in 2019, strives to make public education more equitable. He has used data and algorithms to overhaul school choice systems in Boston, New York and other U.S. cities. Now he’s applying his research to the question of how to equitably distribute vaccines and other medical resources.
Since we last talked, I released a paper on the effects of universal preschool. A lot of people are interested right now because [universal preschool, which is open to everyone with no income rule,] is part of the White House’s agenda. Because of the work we had done with Boston with their school choice algorithm over the years, we had some files on school admissions going back to the late 1990s. Boston was a leader nationwide in expanding slots for children in preschool. But, like many cities, there weren’t enough slots for demand, so they had to ration. And that’s where the lotteries come in.
Fast forward to now. We linked these applicant cohorts to standardized test scores and educational outcomes all the way into college. And what we found was pretty exciting: Those who won the [preschool] lottery are more likely to graduate high school, they score higher on SATs and they’re more likely to enroll in college. Boston has continued to refine and try to improve [the lottery system]. It’s a model for other cities that are expanding public preschool.
COVID-19 was this huge shock. We all were looking around for how we could be useful, using our respective toolboxes. Tayfun Sönmez, M. Utku Ünver and M. Bumin Yenmez, all of Boston College — the four of us — started to study how scarce medical resources are rationed. And it turns out, there are some parallels with the way school seats are rationed.
One of the ideas that we’ve explored is the idea of a reserve system. In cases where people can’t agree on what’s fair, who should get a vaccine first? It’s very similar to who should get into a school. And the way that [schools] have handled that is they set up more elaborate versions of priority systems. With a vaccine reserve system, you basically have a [supply] that’s reserved for cardiac communities, and one that’s reserved for frontline medical personnel, so on and so forth…. States like California and Massachusetts have used some of our ideas [for their reserve systems].
My wife [Ruma Rajbhandari] is a medical doctor, and my sister [Sapana Adhikari] is an emergency room physician. A big part of my interest in medical rationing guidelines was their having to go to the hospital in March 2020 not knowing what the risks were and not having personal protective equipment. That was something that got me really keen on this debate about frontline health care workers, do they get first priority or not?
I have a kindergartner who was virtual this past year. And he did an amazing job with it. I think what the pandemic has done is rip the Band-Aid off on these lingering problems in society — inequitable access to health care, inequitable access to education, inefficiencies in both of the systems — and has made them much more pronounced. That’s been the theme of our research throughout. We hope more people take these issues on, because the way COVID-19 played out was really a scarring event in terms of haves and the have-nots.
— Interview by Cassie Martin
Evolutionary anthropologist
Duke University
Jenny Tung, featured in 2018, studies how social environments — including social status, relationships and isolation — influence primates’ genes and health. Her study subjects have included captive rhesus macaques and wild baboons.
We have built layers of complexity onto [our] initial story. A few years ago we were showing that it’s possible for social interactions to have profound effects on the function of our genome. And now we’re trying to derive a much better understanding of how and why and when, and what are the exceptions.
The other thing I’m really excited about is our ability to move away from this very powerful but very artificial system using captive primates and to ask about what’s going on in the field with wild monkeys. I’ve studied wild baboons in Kenya for many, many years. We know a lot about the social environments, the social experiences. And now with the ability to collect some simple blood samples, we’re also seeing strong signatures of things like social status and social integration, social bonds, social connectedness in the function of these animals’ genomes. That’s pretty exciting because lab studies are powerful and wonderful, but there’s always this question of, “Well, is this real in the real world?”
It was a real honor. It has encouraged us to continue down some of these paths … and to also do some more comparative work and think about species beyond the ones that I have traditionally studied. So in the past few years, I’ve picked up work in other social mammals — wild meerkats and these very social rodents called mole rats — that have their own advantages in giving us insight into how our social world has shaped both how we came to be, our evolutionary past, and how we do day to day in our present.
I’ve been doing more work on something that’s an old love of mine: trying to understand the evolutionary consequences of intermixing between different primates. The population of baboons that I study in Kenya actually sits right at the edge of where the ranges of two different species of baboons meet. And so this population is intermixed between one species, the Anubis baboon, and this other species, the yellow baboon.… We think those patterns of intermixture influence some things about what [the animals] look like, how they behave and so on.…
We know that [humans] have also intermixed a lot with some groups that don’t even exist today, like Neandertals and Denisovans. That process of admixture that we observe right now in living primates [is] potentially relevant to understanding our species’s history.
In many ways, I felt very fortunate during the pandemic; as an academic with tenure, I have a secure job. But we were also home with a 3-year-old for a long stretch. I spend usually at least a month a year in Kenya, and I have since 2006. But not in 2020. We had to figure out some way of keeping [the research] continuous without any ability to travel there. We have a permanent staff in Kenya — they are Kenyan — who are very important to us and have been working with our project in some cases for many decades, and they were having their own issues, and isolation, and risks in the face of a lot of uncertainty.
I spend a lot of time in my research life thinking about social interactions. And every species that I study … they live in groups. And humans, to a large extent, we live together. We didn’t evolve to be on our own for a long period of time. And so I spent a lot of time reading and thinking and working on, “Why when you don’t have the right sort of social connections, why does your risk of death just shoot up? What’s the consequence of chronic social stress?” One of the things that I really appreciate in a more visceral manner [now] is how important my social network is to me. I think that we’re all looking for ways to connect during the pandemic. And that’s when your personal experience and the things that you’re writing papers about and thinking about really collide.
— Interview by Aina Abell
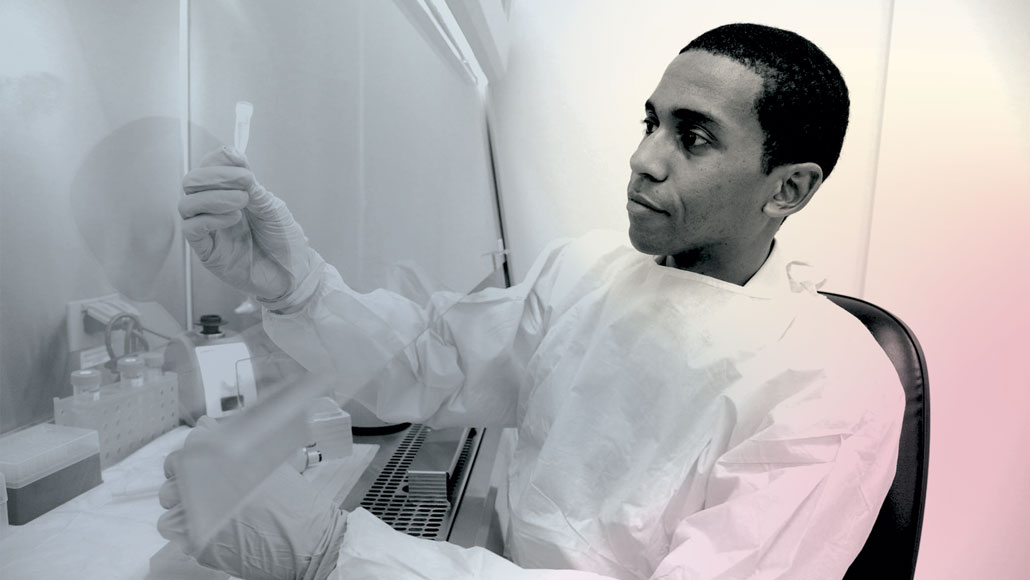
Molecular biologist
Thrive Early Detection
Isaac Kinde, featured in 2015, is developing tests to detect cancer early, when treatment is more likely to be successful. In 2019, PapGene, a small biotech start-up where he was chief scientific officer, was acquired by Thrive, cofounded by Kinde. Just this year, it got the backing of the much larger cancer diagnostics firm Exact Sciences.
Thrive basically acquired the predecessor company [PapGene]…. There was a lot more money, there’s a lot more expertise, but the core mission didn’t change, which is to develop cancer diagnostic products that we think will have an impact on the lives of people with cancer. We have essentially turbocharged and focused our efforts, leading with the most promising product, which is CancerSEEK.
The premise is we can reduce cancer morbidity and mortality through earlier detection. CancerSEEK is a blood test, and it is a multi-cancer test. That contrasts with the current paradigm, which is one test, one cancer.… Right now, all of our efforts are on making it commercially available.
There’s good evidence for detecting over 60 to 70 percent of the cancers that cause the most deaths per year. That boils down to … colon, breast, lung…. But the [full] range is bigger than those three. There’s esophageal, gastric, kidney, pancreatic. There’s data that support maybe 12 to 13 different cancers.
We call it a landmark study because it was the first demonstration in a prospective setting of how a multicancer blood test could be used in real time to report results to patients with cancer.
We looked at 10,000 women in the Geisinger Health system. It’s primarily women who are in Pennsylvania…. In the study, 24 [women had cancers] detected with standard-of-care screening: colonoscopy, mammography or low-dose CT scan for lung. Then there were 26 cancers in which the CancerSEEK test detected the cancer first…. Sixty-five percent of the cancers we detected were at a stage prior to stage 4. So [the addition of CancerSEEK] doubled the number of cases that were [found before symptoms were reported] — in many, many cases early enough where some effective therapies could be implemented.
And then it was also safe…. There were very few false positives, and we could very quickly resolve the false positives with whole-body PET-CT imaging. At least two patients [who first had detections from CancerSEEK] had their cancers successfully removed and are thriving as of the last time we checked.
It fans the flame, right? The reason why cancer screening went down is not because there was less cancer. It was [just] more difficult for whatever reason to get the appropriate standard-of-care test.… All this did was just strengthen the case that more tools, easier tools are needed for cancer screening. And I think maybe the other feeling is just wishing we could go even faster, but balancing a commercial launch with having all the right pieces in place that will set us up for success.
— Interview by Ashley Braun

Biologist
Qihan Biotech
When featured in 2017, Luhan Yang had cofounded and was chief scientific officer of eGenesis, a biotech start-up. She is now cofounder and CEO of Qihan Biotech, based in Hangzhou, China, which aims to develop animal organs that are safe for human transplant and to make cell therapies that can treat conditions such as cancer and autoimmune diseases more widely accessible.
The concept of xenotransplantation is to use animal organs as an alternative resource for human transplantation, since there is a huge unmet need for organs. There are two fundamental issues to be addressed. One is [that] there are endogenous retroviruses in the pig genome — some virus sequences — and they can jump around within the pig genome. The viruses can also jump from the pig cell to the human cell. So there is a potential cross-species transmission, which is a huge safety and regulatory concern.… The second hurdle of using pig organs for human transplant, as you can imagine, is rejection, and it is tremendous.
Those are the two fundamental problems … and that’s where we think gene editing can come into play. By 2017, our team had knocked out 62 [retrovirus copies]. Since then, there are three notable milestones: First, we have created our Pig 2.0, with 15 modifications for immunology…. Last year in Nature Biomedical Engineering, we showed that those modifications are properly expressed in the pig cell, and the resulting pig is healthy, as well as fertile, and the genetic modification can be passed to the offspring. The second part is we combined the [retrovirus] knockout and the immune rejection–related modification in a single pig. We call it Pig 3.0. So that is a prototype close to clinical trial.
The third part is the most exciting part for us: We need to test the function. [In a recent study published in the American Journal of Transplantation,] we put the pig kidney into a monkey. If it’s a normal pig kidney, it will be rejected in a few minutes. And right now the longest survival of our monkey is about one year.… The monkey experiment demonstrates the possibility of achieving long-term xenotransplantation.
Being a leader in biotech is not all business. There are three components that are needed. The first part is to set the vision and strategy of the company. In such an innovative area, I think the scientific knowledge, the breadth of the exposure, I think that’s my strength.… The second part is to recruit, retain and train people. And the last part is some business judgment, like how to do fund-raising, how to organize a project, the accounting. I have to admit, I’m not the expert. But I think at my position, the key is to recruit the best people to do the job.… And I started to embrace that every leader has different strengths and weaknesses.
I was hoping we could have more in-person meetings or travels, but right now, China still has the quarantine policy that makes it super inconvenient for international travel. Hopefully with the vaccine, the world will become what it was.
I feel the world is more divided compared with 10 years before. And I hope at least for medicine, we can see that our enemy is not a different country, but our enemy is cancer, is organ failure, is COVID, that we can keep and strengthen the collaboration across borders.
— Interview by Aina Abell

Scientist and designer
CarbonPlan
When he was featured in 2016, Jeremy Freeman was developing new tools and methods to help scientists better analyze brain data. Now he is executive director of CarbonPlan, a nonprofit organization that he founded in March 2020 to tackle the climate crisis through open-source data and research.
I moved very far from neuroscience, and I’m now exclusively working on climate change. Our focus [at CarbonPlan] is the scientific integrity and transparency of climate solutions. [We do] a combination of research on different areas of climate science and strategies for addressing climate change. We [also] produce a variety of resources and tools for both the research community and the public at large.
Despite being a radically different field, there are some interesting commonalities, in terms of the value of having very accessible, open, publicly available data that speaks to critical issues. [For climate change,] issues around both what is changing in the climate and how we might address that, in different strategies we might take. Having as much of that information be developed in the open, in a way that others can contribute to, and making work available for others to read and evaluate and criticize and engage with — those are [also] values I felt really strongly about in the world of biomedical science.
We have done a lot of analysis identifying very specific ways in which the implementation of forest carbon offset programs [the planting or preservation of trees to attempt to compensate for carbon emissions] haven’t worked. We did a comprehensive analysis of the role of forest carbon offsets in California’s cap-and-trade program, which is a massive sort of market of offsets on the order of $2 billion, and we identified about $400 million worth of offset credits that in our analysis do not reflect real climate benefits because of errors in how they were calculated with respect to issues that involve fundamental problems in statistics and ecology.
That team effort, led by Grayson Badgley and Danny Cullenward, along with a lot of other work that we’ve done on the role of offsets, is really starting to change the conversation, and wake people up to the fact that these approaches to dealing with climate change haven’t been working.
There’s an area known as carbon removal, which refers to any mechanisms that draw down CO2 from the atmosphere. And carbon removal is really, really complicated, because there are a lot of different ways to potentially accomplish that.… So that’s an area where we’ve been very involved, studying, analyzing, comparing. We helped write, edit and produce a book called the CDR Primer — carbon dioxide removal primer. It’s, of course, a publicly available resource.
Absolutely.… Climate change is so fundamentally an issue of equity and an issue of justice. The burdens of climate change are going to be borne by those who were not directly responsible for it, and those who in many ways have been responsible for it will be more able to avoid its impacts. And there’s a deep injustice in that.… How to think about that is an important aspect of our work.… We’re interested in finding a way to be really complementary to a lot of existing community efforts around these issues.
— Interview by Aina Abell
Astrophysicist
Universidad Diego Portales
Paula Jofré, featured in 2018, used the chemical composition of stars across the Milky Way like DNA to map the stars’ family tree. She recently filled in some details of the tree — and is filling a gap in the publishing world by writing a book about stars in Spanish.
In the first paper, the tree had three main branches. There was one that we could associate with a young thin disk, which is one of the populations in the Milky Way. Another was associated with an old, thick disk, which was the older component of the Milky Way. And then we had something in between…. Now, because we had more stars and more chemical elements and we made a better selection of which chemical elements to include, we could find that this strange population was actually an ancestor population of the thin disk. And one of the interpretations we had in the second paper [published in January in the Monthly Notices of the Royal Astronomical Society] was that they were produced all very quickly.
Other groups have found striking evidence of a galaxy that was merged into the Milky Way [billions of years ago]. And that [merging and mixing of gas] could have triggered what is called a star formation burst — lots of stars [forming] at the same time. So, it’s kind of exciting that we find in the tree a feature that could be attributed to a star formation burst … a few gigayears after the [merger of these two galaxies] that we know happened.
It’s going to be published in November [in Chile]. It’s a book in Spanish for the public. I am teaching a class about stars in the Milky Way, a general astronomy class. And I’ve been finding that there is no proper literature in Spanish for the students.… The level is sometimes way too basic or too complex. So I wanted to write something for their level.
[The book] explains how stars create the chemical elements, what’s the role of Gaia [a satellite mission to map the galaxy], what’s the role of the Milky Way Mapper [another survey using Earth-based telescopes], about all these big surveys, why we care, what’s going on.
When I started writing it, of course, I started reading other books…. In all these general astronomy books, women are never highlighted. In my book, I have lots of quotes from 40 different women all around the world, working in my field.… I want to make the point that you can be a woman, you can be clever, you can dedicate yourself to something that is mentally challenging. You can be like any of these 40 women.
The biggest challenge has been to promote hiring more women at the faculty level. Chile’s a very small country and they love new figures, young figures being highlighted by the United States. The moment I was in Science News,I became very popular [in Chile] very quickly. They needed the inspirational woman. And I kept saying, “I don’t want to be the only one. I want more women.”
I don’t know if you were aware of this collective Las Tesis; they made a dance for the social unrest that we had in Chile before the pandemic. It was a feminist movement that resonated for so many people in the world. The movement [says]: We want to be treated with respect, we want the same salary, we want the same opportunities, we want to feel safe on the streets.… But then, when you are fewer in academia, you’re not going to start jumping on the table and dancing, right? You have to argue … it’s difficult.
— Interview by Ashley Braun

Bioengineer
Stanford University
By disabling the DNA-cutting enzyme in the CRISPR system, Stanley Qi, featured in 2019, created a new and versatile tool. Attaching a range of molecules to these “dead Cas” enzymes has yielded an entire toolbox worth of DNA and RNA manipulators.
I feel it’s getting more popular, for a number of reasons: One, people use … this tool to study how the genome works. Two, there are some new efforts using the tool to treat some genetic diseases. And three, there are some other exciting uses of this tool to think about other diseases, other topics that we can possibly tackle.
For example, this CRISPR system came from bacteria cells, right? They were used as weapons by the bacteria to fight against invading viruses. So we said, “OK, humans also have many foes like invading viruses. Can we repurpose this CRISPR to help us fight our infectious diseases?” That was the idea before the COVID-19 pandemic. We practiced first on influenza, seasonal flu…. We adapted a type of CRISPR system that targets a specific RNA molecule, and it works pretty well. I remember it working in January [2020] when the news started reporting, “Oh, there’s a new virus, it’s an RNA virus,” and we thought immediately, “What if we use this tool on this new RNA virus?”
Instead [of using the live virus], we used synthetic biology to mimic the RNA sequence.… [And we found] we can still very rapidly cleave and destroy this RNA virus and its fragments in the human lung cells. We were really excited. Since then we’ve been working very hard to follow up on the idea, to make this as fast as possible into a possible antiviral. We called it PAC-MAN.
One bigger use is for treating disease like a gene therapy. However, there’s still a number of features that have not been ideal for easy use or testing in clinics.… [For patient care,] people always think about making the system very, very compact and suitable into a nanoparticle or into a viral particle, so we can deliver them with ease into the human body. So that requires a miniaturization of the CRISPR system. And we actually did some work on that…. They are like two-thirds smaller than what people use.
And second is, many of these natural proteins from bacteria don’t work very well [in human cells].… So we did some protein engineering. Following these efforts, we actually created some highly compact, yet highly efficient dCas systems that can be easily delivered into the human body to turn on or off genes.
We are bioengineers and we think our strength is in creating stuff, modifying. Now as we step into the domain of applying these tools to solve real-world problems, the challenge is how to build a bridge between where we are to where we want to go. That usually requires learning a significant amount about a disease, about a new field, and thinking creatively on how to interface two fields.
— Interview by Ashley Braun

Atmospheric chemist
Colorado State University
Emily Fischer, featured in 2020, is in the midst of one of the most comprehensive analyses of wildfire smoke ever attempted. Since we last chatted with Fischer, her wildfire research and the way she talks about it have become more personal.
We’re looking at the impact of smoke on the visible light range where photosynthesis occurs. There’s smoke blanketing the U.S. in summers now. Regardless of whether it’s at the ground, it’s somewhere in the atmosphere between the sun and the plants on the ground. In the Midwest, for example, over our corn and soybean belt, there’s smoke between a third to half of the days on average in July and August, during peak growing season. What does that mean for crops? How is that changing the light at the surface? If it’s boosting the diffuse fraction of radiation, and not decreasing the total radiation, that’s a boost to productivity.
We are a nonpartisan group of scientists who are also mothers. The goal of Science Moms is for us to speak directly [via a website, videos and events] on climate change to other mothers in ways that are accurate, digestible and also engaging. While roughly 60 percent of the U.S. population is worried about climate change, like 85 percent of moms are worried about climate change. But they don’t feel comfortable talking about it, or know how to talk to their representatives about it or even talk to their book club about it.
I get all sorts of messages: “This is so different than any other climate communication that I’ve ever seen.” We’re trained as scientists to take the emotion out of things, but actually it’s very important for people to understand the feeling of climate change.
Last summer [2020], extreme fires impacted my own home. We had smoke here for multiple months, and my family ran from the Cameron Peak Fire.… For me, there was a shift from “These are the numbers, these are the graphs,” to “Oh, this is what my graphs feel like, this is what this trend feels like.”
I’m the kind of person who studies what I see.… And so I should not have been surprised by that fire. I was out backpacking with my family, and it started one range over and my kids and I ran out, and we made it. So it was OK, but I was not sure it would be OK. When something like that happens to you, you have to respond to it. [Now] I think, when we calculate a change in something going forward, what does that mean? What are all the impacts that that could have?
Also, seeing the incident management teams working together to help people [during the fire] was very inspiring. I would say to my husband, “These teams are beautiful. They are functioning at such a high level under such hard conditions. If we could just harness this level of cooperation toward climate change action, or toward eliminating the pandemic, we [could] do anything.”
— Interview by Cassie Martin
Astronomer
Columbia University
After being featured in 2017, David Kipping and his colleagues formally reported in Science Advances the first detection of a potential exomoon — a moon orbiting a planet outside of the solar system. Signs of the Neptune-sized moon were spotted around a Jupiter-sized planet 8,000 light-years from Earth. Kipping has been hunting for more ever since, and has also become a hit on YouTube.
Well, I can’t really talk about that. We are close to releasing the results of a new survey of the ensemble of Jupiter-like planets discovered by the Kepler space telescope. Such planets are thought to be the best hunting ground for moons, being far from the gravitational influence of their star and large enough to support potentially massive moons. Unfortunately, the results are still not quite ready.
The community is naturally skeptical. That was kind of the story of exoplanets. When researchers first discovered a hot Jupiter, no one believed it. It wasn’t until they discovered about 10 of them that people started to say that, actually, maybe these are real. I don’t know how it’s going to go with any exomoon candidate. Maybe what we’ve found is genuinely bogus, but I obviously hope not. We did our due diligence, and we’re very careful with the results.
It’s maybe not surprising that the first ones we find are going to be so large, because after all, they’re going to be the easiest to detect.… Actually, less than 1 percent of sunlike stars have hot Jupiters, but they dominated all of the first exoplanet detections just because they were so easy to find. Maybe the same thing will play out here.
It’s been pretty overwhelming to us, because I’d never expected to get anywhere near the number of people watching who have watched. The last video [on what’s called the red sky paradox] got 200,000 views, and the one before it got 500,000. I mean, that’s just bonkers. I get e-mails from people, really amazing e-mails, that say how much the channel and the videos mean to them. That’s really incredible.
We have lots of people actually financially supporting us now. We give them special access to the videos and early access to the papers we’re writing. We hang out with some of them once every two months on a livestream and chat about science. It’s starting to be enough that I’m funding students through donations. I have this dream that I do research, it produces cool ideas, I talk about it on my outreach channel, people get excited about it and they support us, which enables me to do more research.
I’m still [working to earn] tenure. It’s obviously one of the most stressful periods of your career because you don’t have that safety net yet that some young tenured colleagues enjoy. At the same time, you’re trying to raise a family and make sure you see your kids growing up. You don’t want to be a ghost at home. And so that’s been tricky, but [the pandemic] enabled me to spend a lot more time at home with the family.
— Interview by Cassie Martin