 in virtual reality](http://blog.apps.npr.org/img/posts/vr-screenshot.jpg) A screenshot of Standing At The Edge Of Geologic Time in virtual reality.
A screenshot of Standing At The Edge Of Geologic Time in virtual reality.
Last Wednesday, the NPR Visuals Team published a virtual reality story about the geologic history of Rocky Mountain National Park. It was weird! Making a virtual reality project on the web presented a lot of new challenges for us. This blog post will explore some of the challenges and how we solved them.
Making the Web Experience
We had three main goals when creating the web experience out of these assets:
- Make an immersive experience out of the 360º photos we had created and the binaural audio we recorded.
- Ensure the experience worked across devices, on phones, desktops and Cardboards.
- Do this on the web. We weren’t interested in Oculus or other things that required users to install software.
Given these requirements, we wanted to work with WebVR. The experimental JavaScript API is basically not supported in any browsers yet, but work on making WebVR a reality is active, and a few projects have sprung up in an attempt to getting people working with WebVR today.
Google VR has created VR View, an incredibly simple way of creating a 360º image viewer. The code is all open source, and we could have modified the experience however we wanted, but the starting point is so opinionated that making an experience that integrated well with our audio and design style felt onerous. But for just getting an image on the page, VR View is as simple as it gets.
Boris Smus maintains the WebVR Boilerplate, a starting point that uses Three.js that has been used by our friends at the LA Times and National Geographic. It is a great starting point, and we would have used this, but we found a project based on Boris’s work called A-frame, spearheaded by Mozilla’s VR group.
An Introduction to A-frame
A-frame’s key feature is its markup-based scene-building system. Instead of building your entire scene in JavaScript, A-frame gives you the ability to build scenes using custom HTML tags. Because A-frame defines custom HTML tags for you, they are treated by the browser as DOM elements, making them manipulable in JavaScript just like any other DOM element.
A simple A-frame scene might look like this:
<a-scene>
    <a-sky src="url/to/my/image.jpg"></a-sky>
</a-scene>
This would build a VR scene that projects an equirectangular image across a 360º sphere. In three lines of markup, we have the basis of our app.
Every A-frame document begins and ends with an <a-scene> tag, just like an HTML document starts and ends with an <html> tag. And just like a valid HTML document, you can only have one.
The <a-sky> tag demonstrates the basic functionality of A-frame. A-frame is based on the “entity-component-system” pattern. The structure of entity-component-system is worth reading in detail, but it basically works like this:
Entities are general objects that, by themselves, do nothing, like an empty <div>. A-frame represents entities as tags. Components define aspects of entities, such as their size, color, geometry or position. These appear in A-frame as attributes of those tags (perhaps confusingly, standard HTML attributes like class still work). Components can have multiple properties; for example, the camera component has a fov property which defines the field of view, an active property which defines whether or not the camera is active and more. Importantly, components are reusable — they do not rely on certain entities to work.
Returning to our example, <a-sky> is our entity, and src is a component that loads an image and projects it into the sky.
There is one caveat to this: <a-sky> is technically not an entity. A-frame provides one extra convenience layer beyond entities and components: primitives. Primitives look like entities, but are in fact an extension of entities that make it easier to perform common tasks, like projecting a 360º image in a 3D scene. In short, they are entities with pre-defined components. An <a-sky> is an entity with a pre-defined geometry component.
Building multiple scenes
In our story, we wanted to display multiple equirectangular images in a sequence tied to our audio story. A-frame poses a problem: you can only have one scene in A-frame. And when A-frame builds that scene, it renders everything at once. So how can you move between multiple scenes inside your one scene? You show and hide entities.
A component available to all entities in A-frame is the visibility component. It works simply: add visible: false to any entity tag and the entity is no longer visible.
Thus, the basic structure of our A-frame scene looked like this:
<a-scene>
    <a-entity class="scene" id="name-of-scene">
        <a-sky src="path/to/image1.jpg" visible="true">
    </a-entity>
    <a-entity class="scene" id="name-of-scene">
        <a-sky src="path/to/image2.jpg" visible="false">
    </a-entity>
    <a-entity class="scene" id="name-of-scene">
        <a-sky src="path/to/image3.jpg" visible="false">
    </a-entity>
    <a-entity class="scene" id="name-of-scene">
        <a-sky src="path/to/image4.jpg" visible="false">
    </a-entity>
</a-scene>
We timed switching visible scenes with certain points in our audio file. By hooking into the HTML5 audio timeupdate event, we could know the current position of our audio at any time. We attached the time we wanted scenes to switch as data attributes on the scene entities. Again, A-frame entities are just DOM elements, so you can do anything with them that you can do to another DOM element.
<a-entity class="scene" id="name-of-scene" data-checkpoint="end-time-in-seconds">
    <a-sky src="path/to/image1.jpg" visible="true">
</a-entity>
…
Using the timeupdate event, we switched the visible scene once we past the end time of the currently visible scene. This is a technique we’ve used many times in the past and you can read more about here.
Animation
Another core piece of A-frame is the ability to animate elements within a scene. We used A-frame’s animation engine to control the “hands-free” experience we offered on desktop.
To do this, we animated A-frame’s camera. The camera itself is an entity within the scene. To animate an entity, you create the animations as tags that are children of the entity. For example:
<a-scene>
    <a-entity camera drag-look-controls>
        <a-animation attribute="rotation" duration="40000" from="10 -80 0" to="0 15 0"></a-animation>
    </a-entity>
</a-scene>
This animation will rotate the camera in 40 seconds.
You can also begin and end animations based on events. You pass the names of the events as attributes on the animation tag:
<a-animation attribute="rotation" duration="40000" from="10 -80 0" to="0 15 0" begin="enter-scene" end="cancel-animation"></a-animation>
Then, in JavaScript, you can have the camera (or any entity) emit an event, which will either begin or end the animation.
var camera = document.querySelector('a-entity[camera]');
camera.emit('enter-scene');
To make our guided experience work, we had an animation for each of our scenes. When we entered the scene at the correct place in the audio, we emitted the proper event that started the animation.
Putting It All Together
While it is great that A-frame is a markup-based system, having the team manage the entire experience by modifying markup would have been frustrating and difficult. So we turned to a system we have been using for years: spreadsheet-driven templating. Using a spreadsheet allowed us to put each entity in its own row. Then, columns corresponded to components on the entity or other data we needed to attach to the entity via data attributes.
A simplified version of the spreadsheet looks like this:
Using Jinja templates and our copytext library, we were able to loop through each row and build our scene. For example, the first row in our sheet would result in the following:
<a-entity class="scene" id="dream-lake" data-name="Dream Lake" data-checkpoint="29" data-fov="80" >
    <a-entity class="sky" visible="false">
        <a-sky src="dl-615.jpg" rotation="0 -250 0"></a-sky>
    </a-entity>
</a-entity>
In a separate spreadsheet, we built each animation we wanted for guided mode. Using the id of the scene, we could effectively join the two sheets together on the id. Here’s a sample of the animation spreadsheet:
Then, within the camera entity as demonstrated above, we can loop through this spreadsheet and build each animation. The first row of the spreadsheet would build this:
<a-entity camera drag-look-controls>
    <a-animation attribute="rotation" dur="40000" from="-10 80 0" to="0 15 0" begin="enter-dream-lake" end="cancel" easing="linear"></a-animation>
    …
</a-entity>
Take note of the begin attribute. By using the id of the scene, each scene’s animation can begin independently. In our JavaScript, we would emit that event as soon as the scene switched.
Combining these two concepts, our A-frame scene looks like this in a Jinja template:
<a-scene>
    <a-entity camera drag-look-controls>
        {% for row in COPY.vr_animations %}
        <a-animation attribute="{{ row.attribute }}" dur="{{ row.duration }}" from="{{ row.from_value }}" to="{{ row.to_value }}" begin="enter-{{ row.id }}" end="cancel" easing="linear"></a-animation>
        {% endfor %}
    </a-entity>
    {% for row in COPY.vr %}
    <a-entity class="scene" id="{{ row.id }}" data-name="{{ row.name }}" data-checkpoint="{{ row.end_time }}" data-fov="{{ row.fov }}">
        <a-entity class="sky" visible="false">
            <a-sky src="{{ row.image }}" rotation="{{ row.image_rotation }}"></a-sky>
        </a-entity>
    </a-entity>
    {% endfor %}
</a-scene>
There are more things unique to our particular UI that I did not include here for sake of simplicity, but you can see the complete HTML file here.
Nine Miscellaneous Tips About Building In A-Frame
There are lots of little things we encountered building a VR experience that didn’t fit in the explanation above but would be good to know.
- We used jPlayer to handle our audio experience. While A-frame provides a sound component, it had strange issues with playback, sometimes placing all the audio in one ear or the other. It was also more apparent with jPlayer how to provide a responsive UI for users to interact with the audio. Also, separating concerns between the playing audio file and the switching of scenes was easier using separate libraries.
- Three.js, which ultimately does all of the projection into 360º space, expects most assets to be sized to the power of two. That means the dimensions should always be a power of two. For example, our equirectangular images were sized to 212 x 211.
- A-frame has to be included on the page before the
<a-scene>is invoked; otherwise, the tags will not be recognized. We included it in the<head>. - Because A-frame has to be included early, it’s smart to use some critical CSS to ensure something loads on your page in a timely manner. A-frame is a very large library. Our app-header.js file is 214 KB, most of which is A-frame.
- Ensure that users cannot enter the VR experience before all assets are loaded. This is as simple as disabling your UI until JavaScript’s native
loadevent fires. - Exiting VR mode on iOS and Android are totally different. On iOS, you rotate your device to portrait mode. On Android, you use the device’s native back button instead of rotating because Android goes into fullscreen mode. Make sure your instructions to the user are accurate for both types of device.
- Ultimately, A-frame renders your scene to a canvas element. You can do anything with that canvas element. We chose to fade the canvas to black and fade back up when switching scenes.
- To date, text in A-frame is hard. There are some plugins and extensions that provide the ability to write on your scene, but it is almost certainly easier at this point to make a transparent PNG and project it onto your scene. In VR mode for our app, we used transparent PNGs to project an annotation telling the user where they were in Rocky Mountain National Park, as seen in the screenshot at the top of this post.
- A-frame ships with a controls component called “look-controls”. We used a plugin called “drag-look-controls”, which is largely the same, except it inverts the click-and-drag experience so that the photo moves in the direction you drag.
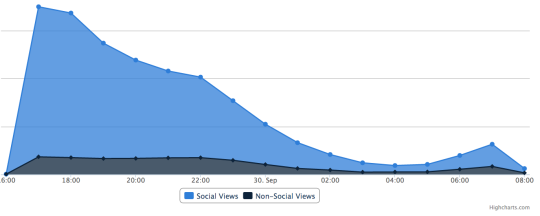
In the coming days, we will publish a couple more things about our project, including how we made our images and soundscapes and what we’ve learned from analytics about how people used our VR project. Stay tuned!
 A screenshot of our elections app titlecard during Mega Tuesday on March 15, 2016.
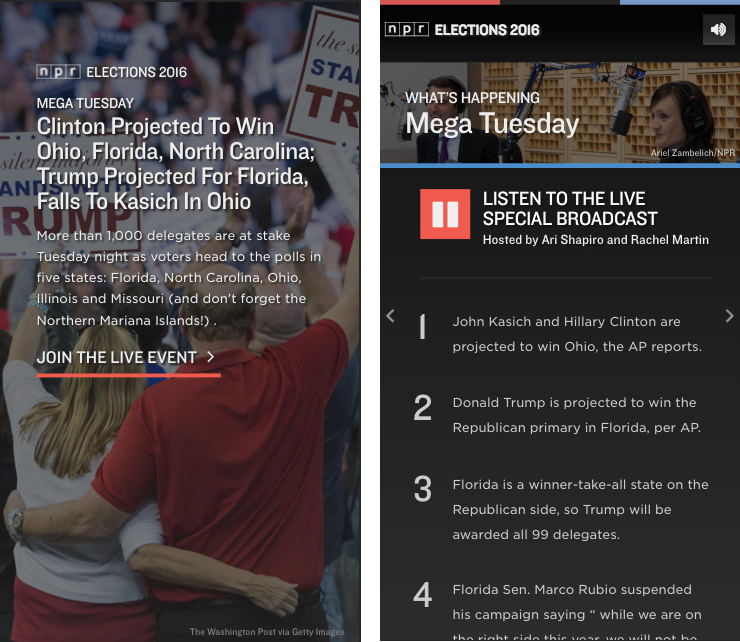 Screenshots of the first two cards of our app during our live broadcast on Mega Tuesday, March 15, 2016.
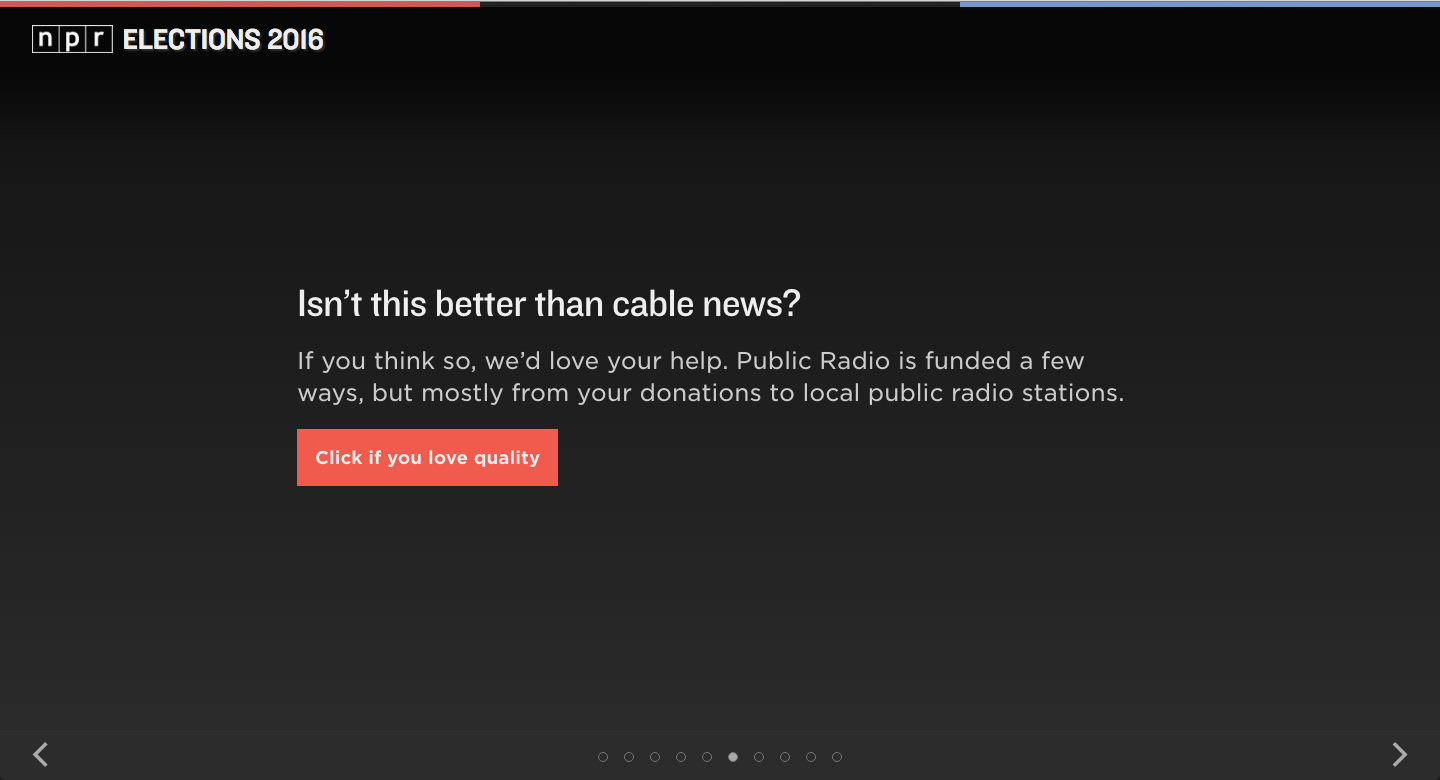


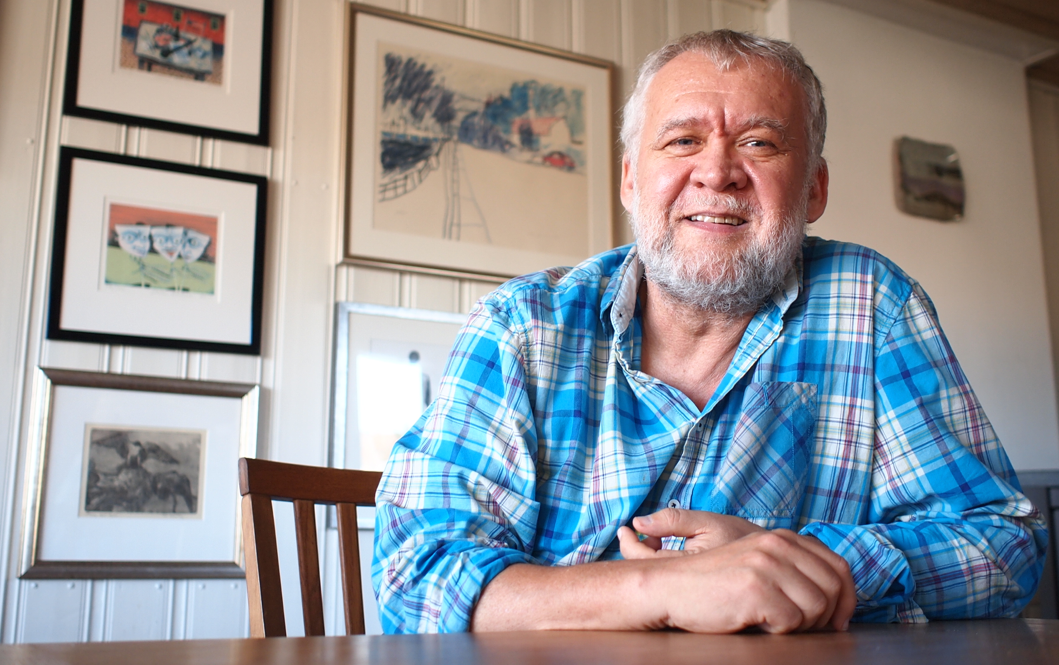
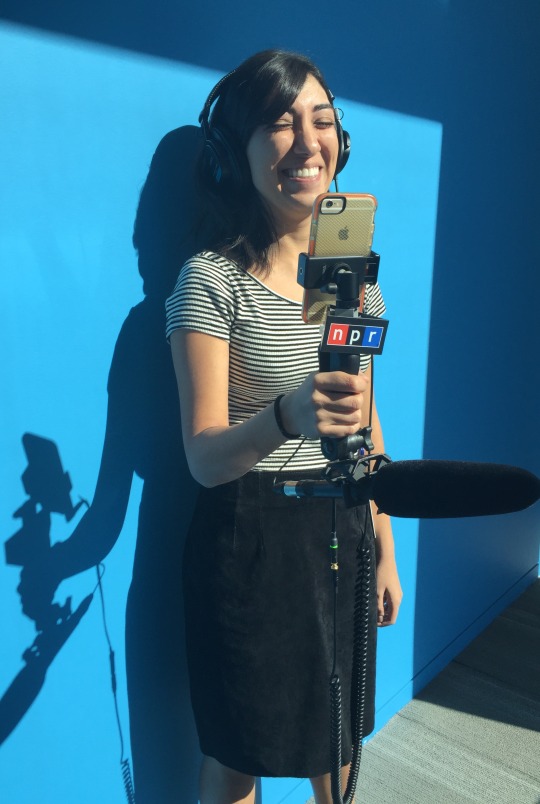
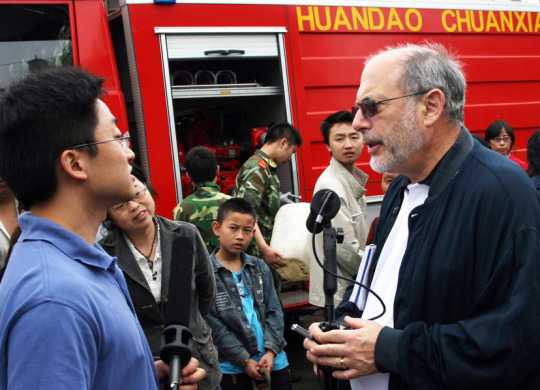
 Photo by Rachael Ketterer
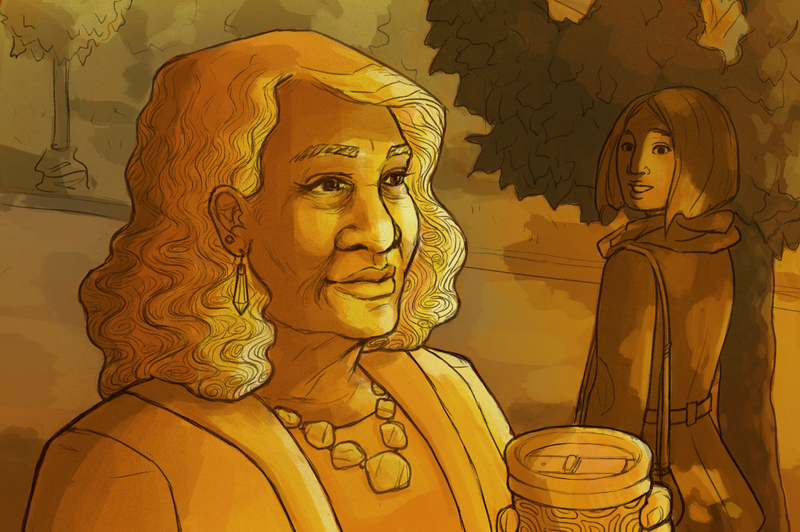 Illustration by viz team intern Annette Elizabeth Allen!


