All posts by media-man

Introducing: AIR’s 2019 Claiming the Rad in Radio Fellows

October 28, 2019—In an effort to bring more sustainable support to women-identifying producers of color in media, AIR has paired five mentors with mentees through our inaugural Claiming the Rad in Radio Fellowship. We’re excited to announce the pairs today. Over the next five months, fellows will have time with their mentors to navigate career transitions, assertiveness on the job, dealing with race and gender bias, salary/pay negotiations and finding/creating community for self care. The program will also be accompanied by a series of exclusive webinars specifically designed for the fellowship cohort and their mentorship discussion topics. Meet our fellows below!

Amarachi Anakaraonye and Kim Bui

Amarachi Anakaraonye is a freelance multimedia producer with a keen eye and ear for calling out inequities, and calling in objective subjectivity. She has spent the past decade sojourning the United States, Europe, and Sub-Saharan Africa utilizing her innate empathic nature and cultural sensitivity to explore how Black women experience and transcend trauma within and beyond such institutions as health, education, and media. In 2017, she created her podcast, The Fragmented Whole, a bi-monthly podcast series that simultaneously dismantles and reframes narratives of trauma, displacement, and healing among women of color, particularly Black women. She has guest hosted and produced such podcasts as The Measure of Everyday Life (WNCU 90.7 FM/RTI International) and The Nonprofit Experience (NC State University’s Philanthropy Journal). Amarachi is a proud member of Alpha Kappa Alpha Sorority, Inc. and when she’s not producing new and existing projects, she enjoys cycling, yoga, and dancing. To learn more about Amarachi’s present and future pursuits, visit www.amarachia.com.

Fellowship statement: “My present and future aim is to establish my own multimedia production and marketing company. I have a strong desire to work with organizations prioritizing health equity and media literacy through technological innovation. The ‘Claiming the Rad in Radio’ Fellowship will provide me with critical insight on industry standards to reference when: 1. Educating clients about the significance of multimedia arts in marketing their services in an educational and/or entertaining manner, and 2. Partnering with clients that already realize the significance of using diverse multimedia outlets in marketing, but need guidance in planning, executing, and/or evaluating such assets.”

Gabrielle Berbey and Dmae Roberts

Gabrielle Berbey is a documentary filmmaker and multi-media journalist from San Francisco, based in New York. Interested in exploring how stories can be adapted throughout different forms to have the most impact, Gabrielle’s experience spans across audio and broadcast documentaries. Upon graduating from Bard College with a B.A. in Film/TV and Human Rights, she worked on the producing team for the FRONTLINE PBS award-winning investigative podcast, The FRONTLINE Dispatch. She currently works on the edit team for a PBS broadcast biographical series about Muhammad Ali, directed by Ken Burns. 

Fellowship statement: “Gabrielle’s independent documentary work ranges from radio pieces to short documentaries. With a specific focus on illuminating stories in the Filipino diaspora, she produced a documentary about the last remaining Filipino grocery store in upstate New York, and her senior thesis documentary tells the story of a Filipino-American community grappling with political unrest in the homeland. Throughout this fellowship, she is excited to develop and produce a historical audio documentary about the 1941 attack on Manila Bay, and how the Philippines’ legacy as a U.S. territory has been largely overlooked in American history.”

Elizabeth Estrada and Juleyka Lantigua Williams

Elizabeth Estrada is a Cuban American multimedia producer dedicated to using audio to explore and amplify stories about Latinx communities living in America. She is currently the engagement editor at WHYY’s PlanPhilly where she connects audiences with local news. Elizabeth has worked at the Greater Philadelphia Cultural Alliance, Firelight Media, New York Women in Film & Television and interned at The Pulse. She is a producer and board member at PhillyCAM, Philadelphia’s public access media station, where she was the recipient of the Innovation Award for Radio in 2018.

Elizabeth is a graduate of Ithaca College and The New School University. Originally from Queens, New York, she now lives in South Philadelphia with her fiancé and dog. You can follow her on Twitter @theElizabethEst.

Fellowship statement: “Through this rad fellowship, I hope to cultivate a long-lasting community with other women of color audio producers. I also intend to conquer my fear and finally produce a pilot of a podcast that I’ve been wanting to create for a long time that centers diverse Latinx changemakers.”

Janae Pierre and Alyce Myatt

Janae Pierre is a general assignment reporter and local host of NPR’s All Things Considered at WBHM in Birmingham, Alabama. A native of New Orleans, Pierre has worked and volunteered with several different media organizations, notably NPR affiliate WWNO, the New Orleans Tribune and WBOK 1230AM. In her spare time, Pierre enjoys listening to old vinyl records (she loves that scratchy sound). Some of her favorite artists include Al Green, Gil Scott Heron and Dinah Washington. In early 2019, Pierre was recognized as the “Best Large Market Radio Reporter” by the Alabama Broadcasters Association. She was also listed on Radio Ink’s 2017 “Future African American Leaders in Radio.” 

Fellowship statement: “I’m thrilled to be a part of this mentorship program and I hope to literally ‘claim the rad in radio’ with the help of my mentor Alyce Myatt. With her advisement, I look forward to learning different ways to advance my career and ideas to merge my love for reporting and philanthropy in Birmingham and my hometown, New Orleans.”

Rhana Natour and Carmel Delshad

Rhana Natour is a national reporter and producer with PBS NewsHour in Washington D.C. where she covers a wide array of subjects including stories on technology, race, gender and gun violence. 

Before coming to the NewsHour, Rhana was an associate producer at ABC News in New York. In 2014, she earned an Emmy nomination for her work on the Nightline special “Crisis in Syria.”

Rhana is also passionate about quality long-form storytelling. She was part of the producing team for the feature-length documentary Speed Sisters that follows the first female race car driving team in the Middle East. Rhana is a graduate of the University of Michigan and was a Fulbright scholar to the United Arab Emirates.

The post Introducing: AIR’s 2019 Claiming the Rad in Radio Fellows appeared first on AIR.

Meet this Member! | Elliott Peltzman

Editor’s note: “Meet this Member!,” is an interview series that spotlights AIRsters doing outstanding work in the audio and media industry. This week we feature composer and audio producer, Elliott Peltzman.

1) Where are you based and what do you do?
I am a San Francisco based Composer and Audio Producer with a particular interest in scoring and sound designing podcasts – the weirder the better!

2) A piece of yours (in any medium!) that you would like to share? (And why?)
I’m really proud of this one piece of mine called “Couldn’t Find A Way”. It’s part true-crime, part smoky tiki lounge, part cumbia?? Not really sure what I’d call it. I wrote it outside of any project – just for myself – and to me really showcases my ability to play with tension and release within just a few notes, only two chords. I’m always most proud of one of my pieces when it incites that amazing feeling where you can’t decide if it’s more major or minor and leaves you wanting to dive further in to find out. Also I absolutely love the tone of the guitar I went with 🙂

3) What draws you to storytelling?
The Fiction. There was a certain point in life when I started realizing that the best storytellers are not the most accurate storytellers. And I want it to stay that way. The re-coloring, the erasing and augmenting of storylines; it’s not just juicier and more interesting – it’s the stuff that art is made of! What I love most about composing is creating pieces that incite complex emotions that have the power to guide and influence the narrative when played alongside the spoken word.

4) What’s playing on your radio/audio streaming service right now?
This group Khruangbin have really stolen my heart. They’re really moving mountains for (mostly) instrumental music right now.

5) What’s the most underrated tool (technical or not!) you use in your creative practice?
The standard Marimba sound in Logic is where almost all of my compositions begin and where a lot of them stay! I like anything that helps me move past tech and spend most of my time in the compositional headspace.

6) What is something you want to see more of in the industry?
This is such a self-serving answer, but I’d honestly love to see more podcasts feature the same composer(s) for the entirety of the show, or at least the entirety of each season. I believe most shows would really benefit from the cohesion and composers like myself would create much finer work knowing they can create repeated motifs, unique instrumentation per episode / per character. Delivering one-off themes and/or ambiguous pieces is fun, but I wish there were more positions that would allow me to go as deep as I’d like to!

7) Who’s your radio/audio idol and why?
On the same note as the previous question – my favorite composer to tune in to each week is Sean Real who composes original music for every episode of 99% Invisible. Sean has my dream job and does a very, very good job at it. Always subtle, but never innocuous – quirky as all get out. And most importantly, always very well-suited to the narrative.

8) What’s the best method for people to connect with you (including social media)?
I share new works to my website pretty often and prefer to be reached out to through email (epeltzman@gmail.com). Please don’t hesitate to reach out – that’s why we’re members of AIR!

The post Meet this Member! | Elliott Peltzman appeared first on AIR.

Building a Database From Scratch: Behind the Scenes With Documenting Hate Partners

For nearly three years, ProPublica’s Documenting Hate project has given newsrooms around the country access to a database of personal reports sent to us by readers about hate crimes and bias incidents. We’ve brought aboard more than 180 newsrooms, and some have followed up on these reports — verifying them, uncovering patterns and telling the stories of victims and witnesses. Some partners have done significant data journalism projects of their own to augment what they found in the shared dataset.

The latest such project comes from News12 in Westchester County, New York. Reporter Tara Rosenblum joined the Documenting Hate project after a spate of hate incidents in her coverage area. Last month, News12 aired her five-part series about hate crimes in the Hudson Valley and a half-hour special covering hate in the tri-state area. The station also published a public database of hate incidents going back a decade. It was the result of two years of work.

Rosenblum and her team built the database by requesting records from every police department in their coverage area, following up on tips from Documenting Hate and collecting clips about hate incidents the news network was already reporting on. Getting records was a laborious process, particularly from small agencies, some of which accept requests only by fax. “It was definitely torturous, but a labor of love project,” Rosenblum said.

Never miss the most important reporting from ProPublica’s newsroom. Subscribe to the Big Story newsletter.

She also expanded the scope of the project beyond her local newsroom and brought in News12 reporters from the network’s bureaus in Connecticut, New Jersey, Long Island, the Bronx and Brooklyn. The local newsrooms used Rosenblum’s investigation as their model, examining hate incidents since 2016. In all, six News12 reporters in three states documented around 2,300 hate incidents.

“We knew that this was one of those cases, the more the merrier,” Rosenblum said of collaborating with other newsrooms. “Why not flex our investigative muscle and get everyone working on this at the same time so we can really get a regional look?”

After the series aired, Rosenblum heard from a number of lawmakers — some who said they’d experienced discrimination — as well as students and schools. The special also aired on national and international networks, garnering responses from other states and countries. “A lot of what I heard is people being really grateful that we were shining the light on this,” she said.

Catherine Rentz, a reporter at The Baltimore Sun, wanted to investigate hate incidents in her area after learning how the Maryland State Police tracks hate crimes. (Since this writing, Rentz left the Sun to pursue freelance projects.) Maryland has been collecting hate crime data since the 1980s, so there was much to explore, Rentz said. Her reporting was also sparked by the May 2017 homicide of Richard Collins III, a second lieutenant in the Army who was days away from his college graduation. He was stabbed to death at the University of Maryland in what may have been a racially motivated attack; the suspect will be tried in December.

Rentz began her hate crimes investigation the summer after the killing, and she worked on it on and off for a year, she said. She sent public records requests to the Maryland State Police, city police departments and the state judiciary, and she built a public database of hate crimes and bias incidents reported to police in Maryland from 2016-17, including narratives of the incidents. She also worked with Documenting Hate to look into Maryland-based reports in our database.

To collect the data, she set up a spreadsheet and entered each case by hand, since the state police records were in PDF files and she wasn’t able to easily extract data from them. She had a number of other challenges. For instance, many agencies redacted victims’ names, so it was a challenge to use the data to find potential sources to interview. And when she did find names, some victims didn’t want to talk about what happened to them.

“I completely understood that, and I didn’t want to do any more damage than had already been done,” she said.

In the course of her investigation, Rentz discovered that there were agencies that did collect reports of potential bias crimes, but that they weren’t reporting it to the state police, so the data wasn’t being counted. She also looked at prosecutions; in 2017, there were nearly 400 bias crimes reported to police, but only three hate crime convictions.

Following the Sun’s hate crime reporting, the state police held several trainings with local police and reminded agencies that they’re required by law to turn in their bias crime reports on specific deadlines. In April, the governor signed three new bills into law on hate crimes.

Last year, Reveal investigated hate incidents that involved the invocation of President Donald Trump’s name or policies. They published a longform story and produced a radio show. Reporter Will Carless built a database using reports from the Documenting Hate project and news clips. He worked his way through a color-coded spreadsheet of hundreds of entries to verify reports and find sources to highlight in the story. After the investigation published, Carless says he received emails from readers who said similar incidents had happened to them; others thanked him for connecting the dots and gathering data on previously disparate stories. He also said a few academics told him they were going to include the story in their courses that involve hate speech.

And this year, HuffPost created a database for a forthcoming story examining hate incidents in which the perpetrator used the phrase “go back to your country” or “go back to” a specific country. Their database combined tips submitted to the Documenting Hate project, along with news clips culled from the Lexis-Nexis database, social media reports, as well as police reports gathered by ProPublica. The investigation is slated to publish this fall.

“The thing I want to stress for this project is that this type of hatred or bigotry or white nationalism is kind of ubiquitous and foundational to American society,” said HuffPost reporter Christopher Mathias. “It’s very much a common thing that people who aren’t white in this country experience on a regular basis. There’s no better way to show that than to create a database of many, many incidents like this across the country.”

Like News12, HuffPost opened the project up to its newsroom colleagues, bringing in reporters from HuffPost bureaus in the United Kingdom and Canada. After HuffPost published a questionnaire to collect more stories from readers, its U.K. and Canadian colleagues set up their own crowdsourcing forms to collect stories. (Documenting Hate is a U.S.-based project, and our form is limited to the U.S.) Their plan is to publish stories using the tips they collect when HuffPost’s U.S. newsroom publishes its investigation.

Want to create your own database of hate crimes? Here are some tips about how to get started. 1. Get hate crimes data from your local law enforcement agency.

We have a searchable app where you can see the data we received directly from police departments, as well as the numbers that agencies sent the FBI. (The federal data is deeply flawed, as we’ve found in our reporting.) We have partial 2017 data for some agencies.

If we don’t have data from your police department, you can replicate our records request.

Also, some states, like Maryland and California, release statewide hate crime data reports, so find out if top-line data is publicly available.

Some things to keep in mind:

More than half of hate crime victims don’t report to the police at all. And the police don’t always do a good job handling these crimes.

That’s because police officers don’t always receive adequate training about how to investigate or track hate crimes. Still, training isn’t a guarantee to ensure these crimes are handled properly. Some police mismark hate crimes or don’t know how to fill out forms to properly track these crimes. Some victims believe officers don’t take them seriously; in some cases, victims say police even refuse to fill out a report. 2. Put together a list of known incidents using media reports and crimes tracked by nonprofit organizations.

It’s a good idea to search for clips of suspected hate crimes during the time period in question to compare them to police data. You can use tools like Google News, LexisNexis, Newspapers.com and others.

You can also consult organizations that track incidents and add them to your list of known crimes. They can give you a sense of how police respond to hate crimes against these groups. Here are some examples.

  • CAIR (Muslim community)
  • ADL (Jewish community)
  • SAALT (South Asian community)
  • AAI (Arab community)
  • AVP (LGBTQ community)
  • MALDEF (Latino community)
  • NAACP (black community)
  • NCTE (trans community)
  • HRC (LGBTQ community)
3. Review the police records carefully, and request incident reports to get the full picture.

Once you receive data from the police department, compare it with your list of known hate crimes from media and nonprofit reports. That will be especially useful if the police claim to have no hate crimes in the time period. Ask about any discrepancies.

You can also check to see if the department’s data matches what it sent the FBI. If the department’s numbers don’t match what they sent the feds, ask why.

The best way to get a deeper look at the data is to get narratives. Ask for a police report or talk to the public information officer to get the narrative from the incident report.

Then review the data and incident reports for potential mismarked crimes. Take a look at the types of bias listed for each crime. We found that reports of anti-heterosexual bias crimes were almost always mismarked, either as different types of bias crimes or crimes that weren’t hate crimes at all.

Also check the quantity of each bias type. Is there a large number of a specific bias crime that may not fit with the area’s demographics? We’ve encountered cases in which police marked incidents as having anti-Native American bias in their forms or computer systems because they thought they were selecting “none” or “not applicable.”

Next, check the crime types. We’ve also seen that certain crime types are unlikely to involve a bias motivation but are sometimes erroneously marked as hate crimes; examples include drug charges, suicide, drug overdose and hospice death. Request incident reports, and follow up with police to ask about cases that don’t appear to be bias crimes. Police have often told us that mismarking happens as a result of human error, and that officials will sometimes rectify the errors found.

read more...

Rate Guide: Engineering and Composition

Though radio transmitters have been broadcasting for more than a century, the emerging  podcast industry is disrupting traditional models of audio production. Experienced audio engineers, recordists, sound designers, and composers all bring vital skills that can make a big difference in the sound and quality of any show, however the final audio is distributed.

In addition, experienced professionals who bring skills honed on other productions can provide an unbiased editorial ear, and are often able to improve a project long before production gets underway.

A Brief Glossary

In many cases the roles described here overlap and any one show’s needs is going to vary. Most independent producers do their own recording and they often expect to do their own initial dialog edits. Some sound designers compose original scores. Some do all the mixing and scoring for a show. Some mix engineers are asked to make editorial decisions about how to cut tape.

No glossary or guide can replace a clear and direct conversation about expectations. Whether you’re hiring a freelancer or taking on a new gig, make sure everyone is on the same page about what you need.

audio engineer is a broad term that can be applied to someone in any one of a variety of engineering-related roles.

audio mixer, mix engineer, mastering engineer are all titles for someone who mixes a show or segment.  NPR Training defines mixing as “the process of creating balance, consistency and clarity with differing audio sources.”  An audio mixer or mix engineer brings a clear understanding of audio concepts like phase and gain structure and core tools including equalization, compression, loudness, and restoration software to the mixing process. Mixing is typically the final step of producing an audio story and results in a publishable audio file. “Mastering” actually describes the final step in creating a music album, which follows the mixing stage. The term is not technically applicable to audio storytelling, but it is sometimes used to describe mixing work.

Note: some shops use “mix” to refer to the process of cutting and arranging audio — a clear conversation about expectations will help avoid any misunderstandings.

composer describes a musician who creates original music. A show might commission a composer to create original music designed especially for that show, or they might commission existing music from a composer.

dialogue editor is a term borrowed from the film world for someone who cuts and cleans dialogue. In audio storytelling, this responsibility more often falls to a producer who is charged with cutting the story.

scoring describes the work of creating or identifying, selecting and licensing existing music from a music library or other source to suit the needs of a segment or story. In our research we found composers who were firm that scoring a segment always means composing original music, and other folks who were just as firm that in radio and podcasting work, scoring always means finding music from an existing source. As ever, no glossary is a substitute for a clear conversation about expectations.

sound designer, sound design is another title borrowed from film. Sound design traditionally refers to the practice of cutting and layering sound effects and ambient audio using natural or synthesized sounds.  In audio storytelling it might refer to someone who provides music and pacing decisions, or to someone who customizes a palette of music and sonic materials that form the defining sound of a show. Transom’s series on sound design is a great introduction to the craft. A sound designer might compose original scores themselves, find composers to create original sounds and music, or use sound libraries to identify and license existing music and effects. The bounds of a sound designer’s responsibility can vary a lot: some sound designers do all the mixing, engineering and sound design for a single show.

sound recordist, field recordist, production sound recordist are all terms that describe an audio engineer who records “in the field” outside of a studio. Someone using these titles should be competent with remote recording equipment and able to set up equipment that will optimize recording quality given the constraints of the particular scene.

studio engineer describes an engineer who operates a live broadcast or recording studio.

Engineering, Recording, and Mixing Rates

In our research the rates for mixing, recording and engineering roles varied with experience and sometimes by the complexity of the job but rarely varied by the role. We focused our research on independent contractors, though it is not uncommon for a specialist to be on payroll for a short term appointment. In general, independent contractors should expect to charge at least 30% more than peers doing similar work on payroll.

Rates: Most independent engineers we interviewed cited hourly rates in the $75-125 range, though some experienced professionals charge $150 to $200 or more. Everyone we interviewed quoted day rates commensurate with that range.

Comparable rates for someone doing the same work on payroll, with an employer covering payroll taxes, workers compensation, unemployment insurance would range from $58-96/hour.

Some engineers reported including a fixed number of revisions in their contract, even for work that will ultimately be billed by the hour. They opt to bill at a higher rate for the aggravation of inefficiency.

Tape Syncs are a special case — the work involved in preparation, set up, and follow up on a tape sync is relatively consistent and described in our tape sync rate guide.

Additional fees, consistent with time-and-a-half overtime standards, are typical for unusually long days or condensed schedules.

We also found many folks at all levels working in short term staff positions. Staff rates, which include significant additional benefits (among them access to workers compensation and unemployment insurance, paid sick leave) start at  $30-35/hour for staffers working under the close supervision of a more experienced engineer. Staff engineers, whatever their hourly rate, are entitled by law to overtime pay after working 40 hours in a single week.

A few notes on best practices:

Many people we spoke with noted that newcomers to the field often wait until the last minute to bring a mix engineer onto the team. Though many of the roles described here are technically “post-production,” we’ve avoided that term intentionally. A good mixer, engineer or sound designer can make a big difference in the final quality of a show. Bringing a “post production” team in early can head off problems with recording quality or file organization that will be labor intensive to fix later.

Experienced engineers working across these fields reported including a fixed number of revisions in their contract, even for work that will ultimately be billed by the hour. Revisions, tweaks, corrections and adjustments are part of the work, but when those trickle in piecemeal, the freelancer is stuck managing a lot of inefficient communication. Charging a higher rate for revisions after the first two passes can help encourage efficiency and ensure that everyone is able to do their best work.

Composition Rates

Establishing “standard” rates for original music composition is particularly challenging because

some composers can command substantially more for their work than others. Session musicians and a studio cost money, but some music can be produced “in-the-box” using only software. Most composers take expected usage of the work into account when setting their rates as well.  With those criteria taken into account, a composer will generally propose a flat rate that includes a fixed number of revisions (two or three is typical).

Note that our sample size for composers was both small and diverse so these rates for composition represent snapshots rather than a complete picture of the industry. We’re still including them here because we regularly get questions about budgeting for music.

Composing theme music, or an intro and outro for a weekly public radio show with a national audience might run to $15,000. A smaller budget show or one with a smaller market might expect to pay $2000-$5000 for an original score.

Some shows and sound designers also turn to composers for help scoring a single episode. Though we didn’t find consensus on what constitutes a small or large audience, licensing might look like this, where figures reflect a small, medium or large audience:

Licensing a pre-existing track for use on a single episode: $50 |  $100 | $200

Non-exclusive use of a custom track: $300 | $500 | $750

Exclusive use of a custom produced track or score will vary more widely.

In almost all cases, a composer retains the copyright to the work and use beyond the original intended medium may need to be renegotiated. Many experienced composers and sound designers will ask for revisions to a standard contract that asks for exclusive worldwide use in any medium, or will charge more for that level of licensing.

Methodology

We interviewed experienced radio shows and podcast production houses about what they expect to pay. We interviewed experienced sound designers, composers, and engineers about what they charge. We also talked to professionals working in film or music to get a sense of where rates overlap and reviewed rates. We reviewed existing research including Blue Collar Post Collective’s survey of post-production rates in film and television.

For this guide, we relied heavily on interviews to establish the roles and categories. Rob Byers, Michael Raphael, and Jeremy Bloom helped refine, define and clarify the terms we’ve used here and were absolutely indispensable to the creation of this guide.

AIR’s work on rates

AIR is actively developing a series of guides designed to help independent producers, editors, and engineers set fair and reasonable rates, and to help everyone create accurate and realistic budgets. We want to hear from you.

This guide was posted in October 2019 and has not been updated. Our hope as an organization is that AIR can keep these rate guides up to date but if you’re reading this and it is more than a year old, you should adjust the recommended rate to reflect changes in the cost of work and living.

The post Rate Guide: Engineering and Composition appeared first on AIR.

Do’s and Don’ts of WordPress Security

Do's and Don'ts of WordPress Security

With a great WordPress site comes great responsibility. WordPress offers journalists a distinguished platform to publish and distribute their content, but keeping your site safe and secure can seem like an overwhelming and daunting task. Luckily, keeping your WordPress site in tip-top shape isn’t as difficult as it seems. We’ve put together a list of a few basic do’s and don’ts to follow in order to keep your site running smoothly and securely, along with the basics of WordPress vulnerabilities and how to understand why some WordPress websites end up getting exploited.

Common WordPress Vulnerabilities

Before we discuss what you should and should not do with your WordPress site, it will be helpful for you to understand the two main ways that WordPress sites can end up becoming vulnerable to attackers. 

  1. Outdated Plugins
    The most common way for attackers to exploit WordPress sites is through outdated plugins, which account for nearly 60% of all WordPress breaches. Outdated plugins can leave unintended doors open for unwelcome visitors with insecure code practices, improperly sanitized text fields, or a myriad of other bad practices. Keep your plugins updated.
  2. User Accounts
    Another common way WordPress sites are exploited is through user accounts. Keeping track of who has access to user accounts on your website, and what permission levels each account has, is a great way to prevent unwanted users from coming in and making unwelcome changes to your site. 

Basic Do’s and Don’ts of WordPress Security

Now that we’ve gone over what some of the most commonly exploited WordPress vulnerabilities look like, we can explore a basic list of some do’s and don’ts when it comes to keeping up with your WordPress site. 

Do:

You can find available plugin and WordPress updates by logging into your WordPress admin panel and navigating to plugins -> installed plugins -> updates available.
  • Keep WordPress, plugins and themes up to date
    • Keeping your plugins and themes up to date will not only allow you to use the newest features and tools added, but it will also ensure that any bugs and vulnerabilities in the previous versions won’t be running on your WordPress site.
  • Remove unused users and plugins
    • Removing unused user accounts and plugins from your site will not only help keep your website running smoothly, but it will also limit the number of things that need to be maintained on your WordPress site and prevent more ways for unauthorized users and vulnerabilities to gain access to your site.
  • Set up a backup solution
    • If the unthinkable happens and your site is the unfortunate target of a successful attack, having a backup solution in place will save you a lot of time and headaches. Having a backup solution in place can usually enable you to have your site back up and functioning with the click of a couple of buttons and in a matter of minutes. Taking a few hours to get a solid backup solution in place is a lot better than losing your entire site and having to rebuild it from the ground up if it is compromised.
  • Install an SSL certificate
    • Installing an SSL certificate on your website is a pretty painless process, and it can usually be done for free. Adding an SSL certificate adds an extra layer of security between your WordPress site and its visitors by securing the connection between the two. Adding an SSL certificate to your website is also a great way to instill trust in readers and let them know that you run a legitimate and safe website. Along with the added trust factor, your site will also see a boost in search engine ranking since Google’s algorithms prefer HTTPS-enabled websites.
  • Find a stable host who specializes in WordPress
    • Finding a stable and trustworthy web host that specializes in hosting WordPress sites, such as Flywheel or WPEngine, is one of the most important steps you can take to ensuring the security of your WordPress site. A good web host will work with you to help maintain your WordPress site and even help improve your site speed and performance. 

Don’t:

Changing the default WordPress admin username to something more complex is an easy and simple way to deter some would-be attackers.
  • Don't reuse the same password for multiple accounts
    • This is more of a basic internet security rule as opposed to being WordPress specific, but never use the same password for multiple internet accounts. Instead, find an easy to use password organizer to keep your passwords safe and secure. You should make sure that your WordPress password is a secure mix of capital letters, symbols, and numbers, as a secure password is a simple preventative step to stop an account from becoming compromised.
  • Don't use the default `admin` username
    • Unwanted visitors who try and gain access to WordPress accounts almost always try using the default admin username on the first try. Consider changing the admin username to something different as a simple preventative step.
  • Don't install questionable themes or plugins
    • The beauty of WordPress is that it gives you the freedom to install thousands of free themes and plugins, with mostly all of them being legitimate. However, it’s easy to get caught up in the endless amount of free plugins and themes that you can install. Unfortunately, there are some themes and plugins out there that are made with malevolent intent. Make sure to always read reviews and download plugins and themes from reliable sources, like the WordPress plugin and theme directories.
  • Don't give away admin access
    • Only give out admin access to users you fully trust. Admin accounts come with lots of responsibility. Instead of granting full admin privileges to users, try giving them specific privileges to only certain tools and areas they need access to. When the user no longer needs that access, revoke their permissions.

Security and Speed Go Hand-In-Hand

An additional benefit of following these steps is that most of them will help you speed up your WordPress site speed. For example, reducing the number of plugins you have will help control what we call “plugin bloat”. Having too many plugins may result in slow page load times due to all of their assets and functions having to load on the page at once.

Another area to keep an eye on if you’re looking to increase your site speed is your theme. Lots of themes are built with a lot of unnecessary tools and functions which may be useful sometimes, but most of the time just end up increasing page load times. Verify that the theme you’re installing has been thoroughly tested to see the effects it’ll have on your page speed.

What to Do if Your Site is Compromised

If your site is the unfortunate victim of a successful attack, knowing what to do will save you from a lot of headaches. First off, don’t panic! Panicking will only make the situation worse, and you will need a level head to successfully recover your website. The first step you’ll want to take is finding out what exactly happened and locating the vulnerability that was exploited. Ask yourself these questions:

  • Are you able to log in to your admin panel? 
  • Is your website being redirected to another website? 
  • Is your website not responding at all?

Once you figure out what exactly happened, you can continue to recover your website. At this point, you should contact your hosting provider. Your host has dealt with this before and will know how to help with these next steps:

Having an automated backup solution in place can come really come in handy in the unfortunate event of a successful attack. This image shows Flywheel's backups panel and several nightly backups.
  1. Restore a backup of your site
    • Hopefully, you backed up your site before this attack happened – you should be backing up your site every day! If you have, you will restore your website from the latest one. Unfortunately, you will lose any content updates you’ve made between the time of that backup and now, but that is a small price to pay to get your site back up and running. 
  2.  Fix the vulnerability to prevent future attacks
    • After you and/or your host has restored your site to a previous backup, it’s important to remember that it’s still vulnerable to attack. Now is the time to fix whatever vulnerability in your site, whether it be an outdated plugin or user account so that this can’t happen again. 
  3. Change your passwords
    • Once you have your site restored from a previous backup, make sure to change all of the passwords relating to your WordPress site, including your WordPress admin account, MySQL database, SFTP users, and all others that allow access to your website. WordPress.org has also put together a useful FAQ guide on what to do if your site has been hacked and how to get it back up and running.

In Conclusion

WordPress is a great tool for publishers when used properly and maintained often. However, if you ignore maintaining your WordPress themes and plugins, you could potentially welcome unwanted threats to your site. Keeping your WordPress site secure seems daunting at first, but it’s not that big of a hurdle to overcome. Now that we’ve explored the basics of how the majority of WordPress sites are exploited, you can keep an eye out and know what to look for and what best practices to use on your website.

Questions? Get in touch.

Have a question for our team or need help with WordPress design and/or development? Check out INN Labs' full services here, join us for one of our weekly Office Hours, or get in touch!

Making Collaborative Data Projects Easier: Our New Tool, Collaborate, Is Here

On Wednesday, we’re launching a beta test of a new software tool. It’s called Collaborate, and it makes it possible for multiple newsrooms to work together on data projects.

Collaborations are a major part of ProPublica’s approach to journalism, and in the past few years we’ve run several large-scale collaborative projects, including Electionland and Documenting Hate. Along the way, we’ve created software to manage and share the large pools of data used by our hundreds of newsrooms partners. As part of a Google News Initiative grant this year, we’ve beefed up that software and made it open source so that anybody can use it.

Collaborate allows newsrooms to work together around any large shared dataset, especially crowdsourced data. In addition to CSV files and spreadsheets, Collaborate supports live connections to Google Sheets and Forms as well as Screendoor, meaning that updates made to your project in those external data sources will be reflected in Collaborate, too. For example, if you’re collecting tips through Google Forms, any new incoming tips will appear in Collaborate as they come in through your form.

Once you’ve added the data to Collaborate, users can:

  • Create users and restrict access to specific projects;
  • Assign “leads” to other reporters or newsrooms;
  • Track progress and keep notes on each data point;
  • Create a contact log with tipsters;
  • Assign labels to individual data points;
  • Redact names;
  • Sort, filter and export the data.

Collaborate is free and open source. We’ve designed it to be easy to set up for most people, even those without a tech background. That said, the project is in beta, and we’re continuing to resolve bugs.

If you are tech savvy, you can find the code for Collaborate on Github, and you’re welcome to fork the code to make your own changes. (We also invite users to submit bugs on Github.)

This new software is part of our efforts to make it easier for newsrooms to work together; last month, we published a guide to data collaborations, which shares our experiences and best practices we’ve learned through working on some of the largest collaborations in news.

Starting this month, we’ll provide virtual trainings about how to use Collaborate and how to plan and launch crowd-powered projects around shared datasets. We hope newsrooms will find the tool useful, and we welcome your feedback.

Get started here.

read more...

NewsMatch Pop Up Best Practices

There have been some changes since our last blog post around Pop Up best practices for NewsMatch and other special campaigns, so we're releasing an updated guide.

Here are some general recommendations and best practices for using popups as part of NewsMatch, year-round campaigns, or special campaigns on your site. 

Installing the plugin

We recommend using Popup Maker plugin for setting up donation and newsletter signup popups on your site. 

Instructions for installing the plugin and creating a popup.

Recommended Pop Up Settings

Your popup should:

  • Be size “Large” or smaller from Popup Maker’s settings
  • Appear at the center of the bottom of the reader’s screen
  • Appear by sliding up from the bottom of the screen, over 350 milliseconds
  • Have an obvious “Close” button
  • Allow readers to interact with the rest of the page (do not use a full-page overlay)
  • Automatically open after 25 seconds (or more) on the page, because immediate popup appearances can be jarring. It can also be set to open after scrolling down a percentage of the page.
  • Be configured to not appear again for 2 weeks or more once dismissed by a reader
  • Be configured to not show on your donation page

You'll need to configure which pages the popup appears on, using the built-in conditionals feature. For disabling the popup on certain pages or in certain cases, read on in this blog post, or check out Popup Maker's paid extensions.

You'll also probably want to review the Popup Maker themes available and modify them to suit your own site's appearances. Once you've modified or created a theme, edit your popup to make it use your theme.

In addition to using Popup Maker themes, you can style popups using your site's WordPress theme's CSS, Jetpack’s Custom CSS Editor, or any other tool that allows you to define custom styles on your site.

What goes in a popup?

NewsMatch will provide calls to action, images, and gifs to be used leading up to and during the campaign. 

Here are some examples: https://www.newsmatch.org/info/downloads

Non-NewsMatch popups should have an engaging, short call to action along with an eye-catching button.

Need help?

There is a ton of additional information on the WP Popup Maker support pages: https://wppopupmaker.com/support/

If you have questions, sign up for one of INN Labs’ NewsMatch technical support sessions or email the INN Labs team at support@inn.org.

Introducing our newest Largo redesign: Workday Minnesota

Workday Minnesota began publishing in 2000 with support from Minnesota’s labor community and was the first online labor news publication in the United States. Since then, Workday has won many awards and has grown to be a trusted source for news about workers, the economy, worker organizations, and Minnesota communities. It is a project of the Labor Education Service at the University of Minnesota.

This summer, INN Labs teamed up with Workday Minnesota’s editor, Filiberto Nolasco Gomez, and webmaster John See to migrate their outdated Drupal site to the Largo WordPress framework and redesign their brand.

Our goals for this project were to:

  • give Workday Minnestoa a streamlined and modern look and feel
  • improve site performance for readers and usability on the back-end for editors
  • enhance the design and improve engagement for Workday’s long-form investigative pieces
  • empower the Workday team to easily manage and update their WordPress site after launch

Some of our design inspiration came from INN Members with bold, modern designs (such as The Marshall Project, The Intercept and Reveal News) and some from outside of our industry, like nowness.com. We wanted clean, bold headlines, a thoughtful type hierarchy, and a way for photos to take center stage. 

Here's what Filiberto had to say:

“We focused on what it would take to rebuild Workday to be responsive to our readers and enhance investigative reporting. The new website will allow us to display long-form and investigative journalism in a more attractive and readable interface. This version of Workday will also allow us to effectively use multimedia segments to make what can sometimes be dense material more approachable.”

The INN Labs team is excited for this new phase of Workday Minnesota and thankful for the opportunity to help bring it to life.

Out with the old, in with the new

Before and after the workdayminnesota.org redesign.

We created a custom homepage layout that showcases Workday’s latest content with a clean and modern look.

Benefits of this custom homepage are big visuals for larger screens and ease of navigation on smaller screens. Workday editors have room for both curated news from around the web (using the Link Roundups plugin) and their most recently published articles.

A sleek and modern article layout

Workday Minnesota articles, before and after.
A typical Workday Minnesota article, before and after.

Article pages continue the sleek, clean design approach. We left out ads and ineffective sidebars in order to prioritize long reads with custom-designed pull quotes and large, responsively embedded photos and videos. Behind the scenes, our Largo framework works with the new WordPress Gutenberg editor to add essential editing tools for media organizations.

Workday Minnesota's redesign is responsive to all devices.

But wait – there’s more!

We couldn’t stop with just a website redesign without also giving attention to the heart of the brand – the logo. The redesigned logo builds off of the modern, new typefaces for the website and its bold use of the Minnesota state outline (Filiberto’s idea!) is great for lasting brand recognition. In the process of creating the logo, we also incorporated a new tagline that succinctly expresses the mission of Workday Minnesota: “Holding the powerful accountable through the perspective of workers.” The new logo is now being used on the website and across Workday’s social media channels.

Workday Minnesota's new logos.

Questions? Get in touch.

Have a question for our team or need help with WordPress design and/or development? Check out INN Labs full services here, join us for one of our weekly Office Hours, or get in touch!

Working Together Better: Our Guide to Collaborative Data Journalism

Today we’re launching a guidebook on how newsrooms can collaborate around large datasets.

Since our founding 11 years ago, ProPublica has made collaboration one of the central aspects of its journalism. We partner with local and national outlets across the country in many different ways — including to work with us to report stories, to share data and to republish our work. That’s because we understand that in working together, we can do more powerful journalism, reach wider audiences and have more impact.

Never miss the most important reporting from ProPublica’s newsroom. Subscribe to the Big Story newsletter.

In the last several years, we’ve taken on enormous collaborations, working with hundreds of journalists at a time. It started in 2016 with Electionland, a project to monitor voting problems in real time during the presidential election. That project brought together more than 1,000 journalists and students across the country. Then we launched Documenting Hate in 2017, a collaborative investigation that included more than 170 newsrooms reporting on hate crimes and bias incidents. We did Electionland again in 2018, which involved around 120 newsrooms.

In order to make each of these projects work, we developed software that allows hundreds of people to access and work with a shared pool of data. That information included datasets acquired via reporting as well as story tips sent to us by thousands of readers across the country. We’ve also developed hard-won expertise in how to manage these types of large-scale projects.

Thanks to a grant from the Google News Initiative, we’ve created the Collaborative Data Journalism Guide to collaborative data reporting, which we’re launching today. We’re also developing an open-source version of our software, which will be ready this fall (sign up here for updates).

Our guidebook covers:

  • Types of newsroom collaborations and how to start them
  • How a collaboration around crowdsourced data works
  • Questions to consider before starting a crowdsourced collaboration
  • Ways to collaborate around a shared dataset
  • How to set up and manage workflows in data collaborations

The guidebook represents the lessons we’ve learned over the years, but we know it isn’t the only way to do things, so we made the guidebook itself collaborative: We’ve made it easy for others to send us input and additions. Anybody with a GitHub account can send us ideas for changes or even add their own findings and experiences (and if you don’t have a GitHub account, you can do the same by contacting me via email).

We hope our guide will inspire journalists to try out collaborations, even if it’s just one or two partners.

Access the guidebook here.

read more...

Making Sense of Messy Data

I used to work as a sound mixer on film sets, noticing any hums and beeps that would make an actor’s performance useless after a long day’s work. I could take care of the noisiness in the moment, before it became an issue for postproduction editors.

Now as a data analyst, I only get to notice the distracting hums and beeps in the data afterward. I usually get no say in what questions are asked to generate the datasets I work with; answers to surveys or administrative forms are already complete.

To add to that challenge, when building a national dataset across several states, chances are there will be dissonance in how the data is collected from state to state, making it even more complicated to draw meaning from compiled datasets.

Get info about new and updated data from ProPublica.

The Associated Press recently added a comprehensive dataset on medical marijuana registry programs across the U.S. to the ProPublica Data Store. Since a national dataset did not exist, we collected the data from each state through records requests, program reports and department documents.

One question we sought to answer with that data: why people wanted a medical marijuana card in the first place.

The answers came in many different formats, in some cases with a single response question, in others with a multiple response question. It’s the difference between “check one” and “check all.”

When someone answers a single response question, they are choosing what they think is the most important and relevant answer. This may be an accurate assessment of the situation — or an oversimplified take on the question.

When someone is given the chance to choose one or more responses, they are choosing all they think is relevant and important, and in no particular order. If you have four response choices, you may have to split the data into up to 16 separate groups to cover each combination. Or you may be given a summary table with the results for each option without any information on how they combine.

In the medical marijuana data, some states have 10 or more qualifying conditions — from cancer and epilepsy to nausea and post-traumatic stress disorder. Of the 16 states where data on qualifying condition is available, 13 allow for multiple responses. And of those, three states even shifted from collecting single to multiple responses over the years.

This makes it nearly impossible to compare across states when given only summary tables.

So, what can we do?

One tip is to compare states that have similar types of questionnaires — single response with single response, multiple with multiple. We used this approach for clarification when looking into the numbers for patients reporting PTSD as a qualifying condition. We found that half of all patients in New Mexico use medical marijuana to treat PTSD, and the numbers do not seem to be inflated by the method of data collection. New Mexico asks for a single qualifying condition, yet the proportion of people reporting PTSD as their main ailment is two to three times the number than those that could report multiple responses in other states.

Using data from the 13 states that allow multiple responses, we found that when states expand their medical markets to include PTSD, registry numbers ramp up and the proportion of patients reporting PTSD increase at a quick pace. The data didn’t enable us to get one single clean statistic, but it still made it possible for us to better understand how people used medical marijuana.

Get the data (with a description of the caveats you’ll need to keep in mind when working with it) for your own analysis here.

read more...

Announcing Largo 0.6.4

This week's release of updates to the Largo WordPress theme is all about improvements for images, pull quotes, and media. It also brings improved compatibility and editorial functions for the WordPress Block Editor.

This release includes:

An example of the new pull quote block styles.
  • Improved pull quote display. The Pull Quote block gains full styling, so that block quotes and pull quotes no longer appear the same.
  • The ability to insert media credits from the Media Gallery in the block editor.
  • More thumbnail display options for the Series Post widget.
  • Compatibility with WP 5.2's wp_body_open hook, which will be increasingly important for plugin compatibility.

This release also contains a number of fixes and minor updates. Particular thanks go to outside contributor @megabulk.

What's new in 0.6.4?

For the full details on what we've updated in version 0.6.4, including improvements for developers, please see the Largo 0.6.4 official release notes.

You may also want to read the release notes for version 0.6.3 and 0.6.2.

Upgrading to the Latest Version of Largo

Want to update to the latest version of Largo? Follow these instructions, or send us an email!

Before updating, please see the upgrade notices outlined here.

What's next?

When Largo was first released, it contained functionality for things that did not yet exist in WordPress core, like term metadata. Our next release will continue the work already underway to streamline the theme and seamlessly switch to using WordPress' now-built-in functionality.

This is in addition to an overall focus to improve Largo's frontend for mobile-first speed and easy editorial customizations.

Plugins

Another part of the work we’ve done recently with Largo has been to spin out important functionality for publishers into standalone plugins. This makes these features widely available for any WordPress site to use while further streamlining the Largo theme and improving overall performance. We published the Disclaimers plugin last year. The 0.7 release of Largo will complete the transition of the Disclaimers Widget as a standalone plugin by removing the widget from Largo. We're doing the same with our Staff plugin.

New INN Labs publishing tools:

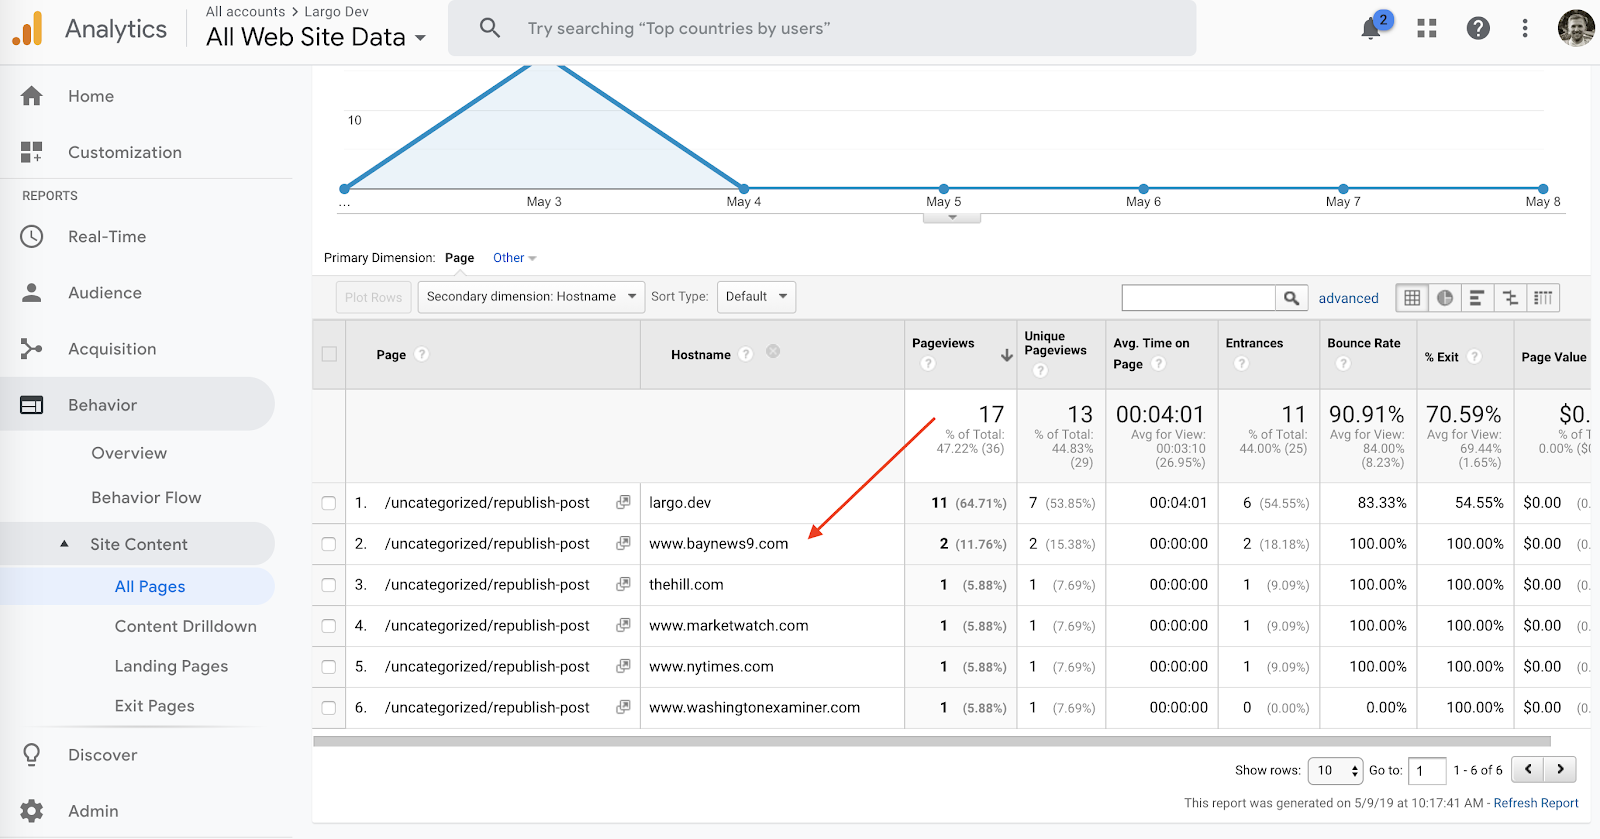
  1. We recently launched the Republication Tracker Tool plugin which allows publishers to easily share their stories with other websites and then track engagement of those shared stories in Google Analytics.
  2. Link Roundups received important updates in the version 1.0 release. This WordPress plugin helps editors aggregate links from around the web and save them as “Saved Links”. You can publish these curated links in widgets and posts in your site, or push Link Roundups directly to subscribers via MailChimp.

Send us Your Feedback

We want to know what you think will make Largo better. Send us an email with your ideas!

“It was hard to take Nazi memes all that seriously when they were sandwiched between sassy cats”

Syracuse’s Whitney Phillips — scholar of the darker corners of Internet culture, author of “The Oxygen of Amplification,” last seen here offering this dire observation/prediction last winter — has a new paper out in Social Media + Society that might make be a bracing experience for some Nieman Lab readers.

When we think of the nightmarish edge of online culture — the trolling, the disinformation, the rage, the profound information pollution — it’s easy to think of the worst offenders. 4chan denizens, for-the-lulz trolls, actual Nazis — you know the type. But, she writes, maybe the origins of those phenomena aren’t only in those dark corners of Internet culture — maybe they’re also in the kind of good Internet culture, the kind that people sometimes get nostalgic about.

I used to believe that the internet used to be fun. Obviously the internet isn’t fun now. Now, keywords in internet studies—certainly, keywords in my own internet studies—include far-right extremism, media manipulation, information pollution, deep state conspiracy theorizing, and a range of vexations stemming from the ethics of amplification.

Until fairly recently, I would sigh and say, remember when memes were funny? When the stakes weren’t so high? I wish it was like that still. I was not alone in these lamentations; when I would find myself musing such things, it was often in the company of other internet researchers, or reporters covering the technology and digital culture beat. Boy oh boy oh boy, we would say. What we wouldn’t do to go back then. It was a simpler time.

…internet/meme culture was a discursive category, one that aligned with and reproduced the norms of whiteness, maleness, middle-classness, and the various tech/geek interests stereotypically associated with middle-class white dudes. In other words: this wasn’t internet culture in the infrastructural sense, that is, anything created on or circulated through the networks of networks that constitute the thing we call The Internet. Nor was it meme culture in the broad contemporary sense, which, as articulated by An Xiao Mina , refers to processes of collaborative creation, regardless of the specific objects that are created. This was a particular culture of a particular demographic, who universalized their experiences on the internet as the internet, and their memes as what memes were.

Now, there is much to say about the degree to which “mainstream” internet culture—at least, what was described as internet culture by its mostly white participants—overlapped with trolling subculture on and around 4chan’s /b/ board, where the subcultural sense of the term “trolling” first emerged in 2003…the intertwine between 4chan and “internet culture” is so deep that you cannot, and you should not, talk about one without talking about the other. However, while trolling has—rightly—been resoundingly condemned for the better part of a decade, the discursive category known as internet culture has, for just as long, been fawned over by advertisers and other entertainment media. The more jagged, trollish edges of “internet culture” may have been sanded off for family-friendly consumption, but the overall category and its distinctive esthetic—one that hinges on irony, remix, and absurd juxtaposition—has in many ways fused with mainstream popular culture.

Specifically, it was the breadth of types within this sort of earlier-web content that opened the door for what we’ve since seen:

The fact that so many identity-based antagonisms, so many normative race and gender assumptions, and generally so much ugliness was nestled alongside all those harmless and fun and funny images drills right to the root of the problem with internet culture nostalgia. A lot of “internet culture” was harmless and fun and funny. But it came with a very high price of entry. To enjoy the fun and funny memes, you had to be willing—you had to be able—to deal with all the ugly ones. When faced with this bargain, many people simply laughed at both. It was hard to take Nazi memes all that seriously when they were sandwiched between sassy cats and golf course enforcement bears, and so, fun and ugly, ugly and fun, all were flattened into morally equivalent images in a flipbook. Others selectively ignored the most upsetting images, or at least found ways to cordon them off as being “just” a joke, or more frequently, “just” trolling, on “just” the internet.

Of course, only certain kinds of people, with certain kinds of experiences, would be able and willing to affect such indiscriminate mirth. Similarly, only certain kinds of people, with certain kinds of experiences, would be able and willing to say, “ok, yes, I know that image is hateful and dehumanizing, so I will blink and not engage with it, or you know, maybe chuckle a little to myself, but I won’t save it, and I won’t post anything in response, and instead will wait patiently until something that’s ok for me to laugh at shows up.”

Phillips calls that response the “ability to disconnect from consequence, from specificity, from anything but one’s own desire to remain amused forever.” And — apologies for all the blockquoting, but it’s good! — she ties that back to some of the journalists who covered this space when its public impact turned more serious down the road.

Very quickly, I realized that many of the young reporters who initially helped amplify the white nationalist “alt right” by pointing and laughing at them, had all come up in and around internet culture-type circles. They may not have been trolls themselves, but their familiarity with trolling subculture, and experience with precisely the kind of discordant swirl featured in the aforementioned early-2000s image dump, perfectly prepped them for pro-Trump shitposting. They knew what this was. This was just trolls being trolls. This was just 4chan being 4chan. This was just the internet. Those Swastikas didn’t mean anything. They recognized the clothes the wolf was wearing, I argued, and so they didn’t recognize the wolf.

This was how the wolf operated: by exploiting the fact that so many (white) people have been trained not to take the things that happen on the internet very seriously. They operated by laundering hate into the mainstream through “ironically” racist memes, then using all that laughter as a radicalization and recruitment tool. They operated by drawing from the media manipulation strategies of the subcultural trolls who came before, back when these behaviors were, to some anyway, still pretty funny.

Go read the whole thing, but here’s the lesson to take from it:

Most foundationally, shaking your head disapprovingly at the obvious villains—the obvious manipulators, the obvious abusers, the obvious fascists—isn’t enough. Abusers, manipulators, and fascists on the internet (or anywhere) certainly warrant disapproving head shakes, and worse. But so does a whole lot else. Pressingly, the things that were—and that for some people, still are—fun and funny and apparently harmless need more careful unpacking. Fun and funny and apparently harmless things have a way of obscuring weapons that privileged people cannot see, because they do not have to see them.

SRCCON 2019 – A first-timer’s recap

Miranda with Jonathan Kealing (INN’s Chief Network Officer) and INN Members Candice Forman from Outlier Media and Asraa Mustufa from Chicago Reporter. We had a blast meeting and chatting in person!

I wasn’t entirely sure what to expect going into my first ever SRCCON, a two-day conference from the folks at OpenNews. The conference is designed to connect news technology and data teams in a hands-on, interactive series of workshops and conversations to address the practical challenges faced by newsrooms today. Leading up to the event, I had heard SRCCON described as “inclusive," “welcoming," and “supportive," which turned out to be an understatement!

As someone relatively new to the world of journalism conferences, and even more new to SRCCON, I was blown away at how many comfortable, friendly, and productive conversations were had before, during, and after the sessions each day. At every table at every meal, and at each session, nearby people took the time to introduce themselves and constantly made me feel welcome and included. 

I loved the opportunity to meet people in person from many INN Member organizations and formed so many new connections with newsrooms far and wide. There is still so much to process from my two days there, but here’s a recap of some of my favorite sessions at SRCCON 2019:

Ghosts in the Machine - How technology is shaping our lives and how we can build a better way

I kicked off the conference by attending this session by facilitators Kaeti Hinck and Stacy-Marie Ishmael that focused on people-centered metrics and outcomes for newsrooms. We discussed issues with commonly-used metrics and brainstormed ways to make these metrics humane and collected in a way that respects people and humanity, rather than just the numbers.

My table discussed at length measuring retweets, shares, and other social engagement statistics and brainstormed ways we can improve these measurements by increasing education around what the statistics mean and considering sentiment behind shares when collecting data. Other tables discussed topics such as measuring changes in policy, comprehension of article content, truly engaging with readers using surveys and rewards for participation, and many other complex topics.

While finding solutions for these issues is challenging, these continued conversations around human-centered metrics and ethics around data collection are incredibly important as technology plays an increasingly important role in how we collect, define, and distribute news. I’m certain that this session wasn’t the end of these conversations, and I can’t wait to see where they go next.

Engineering Beyond Blame

Joe Hart and Vinessa Wan from the New York Times led this session introducing a collaborative method for discussing incidents and outages within today’s complex systems via blameless PostMortems called “Learning Reviews." They made the point that complex systems we work with today necessitate a need to prioritize learning opportunities over blame and punishment. The traditional idea of a single point of failure often doesn’t exist in complex systems where many factors can combine to lead to an incident or outage.

The goal of these “Learning Reviews” is to create a psychologically safe space where an honest and thorough investigation can happen to determine where the system or current team process failed, rather than on individual blame. They outlined how to create a defined process for these reviews, and then walked us through several small group exercises to demonstrate how complexity necessitates this approach. Here’s an article with more information about The Times Open Team’s approach and how they utilized it for Midterm election coverage.

What Happens to Journalism When AI Eats the World?

This was a fascinating and thought-provoking session led by Sarah Schmalbach and Ajay Chainani from the Lenfest Local Lab that examined the ethics behind the emerging field of AI, machine learning, and deep learning, and the effect these questions can have on the world around us.

We started with a group conversation about some of the AI horror stories we’ve heard about in the news or in our own lives, but then also discussed some of the groundbreaking AI work advancing journalism and helping make positive impacts on our world. 

They then led us through a series of small group discussions where we came up with our own AI product and then evaluated it using common ethics standards from companies such as Microsoft and Google. The main takeaway was giving everyone in the room an ethical framework for evaluating AI news projects and the confidence to continue these discussions moving forward.  

Thanks to Sarah and Ajay for leading such a deep and thought-provoking session!

Other highlights from the conference:

  • Brainstorming ways to explain complex topics in a very unique setting:
Jennifer LaFleur, Aaron Kessler, and Eric Sagara led an awesome session about creative ways to teach complex issues in the Heritage Gallery at McNamara Alumni Center.
  • New to SRCCON for 2019 was the Science Fair, a chance to informally check out journalism tools and resources with interactive demos. Here’s INN’s Jonathan Kealing trying out a VR news story from the Los Angeles Times:
 Jonathan Kealing checks out the size of a studio apartment via a VR headset, a project from the Los Angeles Times as part of their immersive storytelling demo.
  • I chose to end the conference by witnessing a bit of friendly competition at “CMS Demos: Approaches to Helping Our Newsrooms Do Their Best Work." The demos featured a walkthrough of writing, editing, and publishing a news story from 5 different custom CMS platforms, along with some light-hearted competition and a lot of laughs. Included in the demos were:
    • Scoop, from the New York Times
    • Arc, from Washington Post
    • Chorus, from Vox
    • Copilot, from Condé Nast
    • Divesite, from Industry Dive

Overall, SRCCON 2019 exceeded my expectations as a first-time attendee, and was such an incredible opportunity to network, address important issues through interactive sessions, and have a ton of meaningful conversations with newsrooms from all over. Events like this remind us why we do the work we do with nonprofit newsrooms and inspire us to continue addressing the challenges faced by newsrooms today. Thanks so much to OpenNews and all the other sponsors, volunteers, and fellow attendees that made SRCCON 2019 possible!  

Sold! Randa Duncan Williams buys Texas Monthly, the latest legacy brand to enjoy billionaire ownership

There’s a party going on deep in the heart of Texas. Texas Monthly is the latest in a series of newsrooms to be scooped up and bolstered by the deep and patient pockets of legacy media-loving billionaires. Randa Duncan Williams, heiress of an oil and gas fortune and a native Texan, chairs the holding company […]

The post Sold! Randa Duncan Williams buys Texas Monthly, the latest legacy brand to enjoy billionaire ownership appeared first on Poynter.

Largo site wins Cleveland Press Club magazine website award

Ben Keith and Lucia Walinchus with Eye on Ohio's first-place award for magazine website.

A photograph of an engraved wood plaque.
The award plaque.

We're happy to relay the news that INN Member Eye on Ohio won First Place Magazine Website in the Press Club of Cleveland's annual All-Ohio Excellence in Journalism Awards. We thank the Club and the judges for their consideration and congratulate Eye on Ohio for their success.

Magazine Website
First place: EyeonOhio.com
Lucia Walinchus, Ben Keith, Eye on Ohio

Eye on Ohio is built using INN Labs' Largo WordPress theme, which is the fruit of many years' work by contributors at INN, at NPR, and from the greater WordPress community. Eye on Ohio executive director listed Labs' lead developer, Ben Keith, as the second contact on the awards for his contributions as an INN Labs employee in Ohio.

Beyond Ben, contributors to Largo include past and present INN staff, folks at NPR's former Project Argo, and community contributors from across the web. We've got a full list in Largo's README over on GitHub.

“Your Default Position Should Be Skepticism” and Other Advice for Data Journalists From Hadley Wickham

So you want to explore the world through data. But how do you actually *do* it?

Hadley Wickham is a leading developer of open source tools for data science and works as the chief scientist at RStudio. We talked with him about interrogating data, what stories might be hiding in the gaps and how bears can really mess things up. What follows is a transcript of our talk, edited for clarity and length.

ProPublica: You’ve talked about the way data visualization can help the process of exploratory data analysis. How would you say this applies to data journalism?

Wickham: I’m not sure whether I should have the answers or you should have the answers! I think the question is: How much of data journalism is reporting the data that you have versus finding the data that you don’t have ... but you should have ... or want to have ... that would tell the really interesting story. Hadley Wickham Courtesy of Hadley Wickham

I help teach a data science class at Stanford, and I was just looking through this dataset on emergency room visits in the United States. There is a sample of every emergency visit from like 2013 to 2017 ... and then there’s this really short narrative, a one-sentence description of what caused the accident.

I think that’s a fascinating dataset because there are so many stories in it. I look at the dataset every year, and each time I try and pull out a little different story. This year, I decided to look at knife-related injuries, and there are massive spikes on Memorial Day, Fourth of July, Thanksgiving, Christmas Day and New Year’s.

As a generalist you want to turn that into a story, and there are so many questions you can ask. That kind of exploration is really a warmup. If you’re more of an investigative data journalist, you’re also looking for the data that isn’t there. You’ve got to force yourself to think, well, what should I be seeing that I’m not?

ProPublica: What’s a tip for someone who thinks that they have found something that isn’t there. What’s the next step that you take when you have that intuition?

Wickham: This is one of the things I learned from going to NICAR, which is completely unnatural to me, and that’s picking up a phone and talking to someone. Which I would never do. There is no situation in my life in which I would ever do that unless it’s life-threatening emergency.

But, I think that’s when you need to just start talking to people. I remember one little anecdote. I was helping a biology student analyze their field work data, and I was looking at where they collected data over time.

And one year they had no data for a given field. And so I go talk to them. And I was like: “Well, why is that? This is really weird.”

And they’re like, well, there was a bear in the field that year. And so we couldn’t collect any data.

But kind of an interesting story, right?

ProPublica: What advice would you have for editors who are managing or collaborating with highly technical people in a journalism environment but who may not share the same skill set? How can they be effective?

Wickham: Learn a little bit of R and basic data analysis skills. You don’t have to be an expert; you don’t have to work with particularly large datasets. It’s a matter of finding something in your own life that’s interesting that you want to dig into.

One [recent example]: I noticed on the account from my yoga class, there was a page that has every single yoga class that I had ever taken.

And so I thought it would be kind of fun to take a look at that. See how things change over time. Everyone has little things like that. You’ve got a Google Sheet of information about your neighbors, or your baby, or your cat, or whatever. Just find something in life where you have data that you’re interested in. Just so you’ve got that little bit of visceral experience of working with data.

The other challenge is: When you’re really good at something, you make it look easy. And then people who don’t know so much are like: “Wow, that looks really easy. It must have taken you 30 minutes to scrape those 15,000 Excel spreadsheets of varying different formats.”

It sounds a little weird, but it’s like juggling. If you’re really, really, really good at juggling, you just make it look easy, and people are like: “Oh well. That’s easy. I can juggle eight balls at a time.” And so jugglers deliberately build mistakes into their acts. I’m not saying that’s a good idea for data science, but you’ve taken this very hard problem, broken it down into several pieces, made the whole thing look easy. How do you also convey that this is something you had to spend a huge amount of time on? It looks easy now, because I’ve spent so much time on it, not because it was a simple problem.

Data cleaning is hard because it always takes longer than you expect. And it’s really, really difficult to predict in advance where the problems are going to lie. At the same time, that’s where you get the value and can do stuff that no one has done before. The easy, clean dataset has already been analyzed to death. If you want something that’s unique and really interesting, you’ve got to dig for it.

ProPublica: During that data cleaning process, is that where the journalist comes out? When you’re cleaning up the data but you’re also getting to know it better and you’re figuring out the questions and the gaps?

Wickham: Yeah, absolutely. That’s one of the things that really irritates me. I think it’s easy to go from “data cleaning” to “Well, you’ve got a data cleaning problem, you should hire a data janitor to take care of it.” And it’s not this “janitorial” thing. Actually cleaning your data is when you’re getting to know it intimately. That’s not something you can hand off to someone else. It’s an absolutely critical part of the data science process.

ProPublica: The perennial question. What makes R an effective environment for data analysis and visualization? What does it offer over other tool sets and platforms?

Wickham: I think you have basically four options. You’ve got R and Python. You’ve got JavaScript, or you’ve got something point and click, which obviously encompasses a very, very large number of tools.

The first question you should ask yourself is: Do I want to use something point and clicky, or do I want to use a programming language? It basically comes down to how much time do you spend? Like, if you’re doing data analysis every day, the time it takes to learn a programming language pays off pretty quickly because you can automate more and more of what you do.

And so then, if you decided you wanted to use a programming language, you’ve got the choice of doing R or Python or JavaScript. If you want to create really amazing visualizations, I think JavaScript is a place to do it, but I can’t imagine doing data cleaning in JavaScript.

So, I think the main competitors are R and Python for all data science work. Obviously, I am tremendously biased because I really love R. Python is awesome, too. But I think the reason that you can start with R is because in R you can learn how to do data science and then you can learn how to program, whereas in Python you’ve got to learn programming and data science simultaneously.

R is kind of a bit of a weird creature as a programming language, but one of the advantages is that you can get some basic templates that you copy and paste. You don’t have to learn what a function is, exactly. You don’t have to learn any programming language jargon. You can just kind of dive in. Whereas with Python you’re gonna learn a little bit more that’s just programming.

ProPublica: It’s true. I’ve tried to make some plots in Python and it was not pretty.

Wickham: Every team I talked to, there are people using R, and there are people using Python, and it’s really important to help those people work together. It’s not a war or a competition. People use different tools for different purposes. I think is very important and one project, to that end, it is this thing called Apache Arrow, which Wes [McKinney] has been working on because of this new organization called Ursa.

Basically, the idea of Apache Arrow is to just to sit down and really think, “What is the best way to store data-science-type data in memory?” Let’s figure that out. And then once we’ve figured it out, let’s build a bunch of shared infrastructure. So Python can store the data in the same way. R can store the data in the same way. Java can store the data in the same way. And then you can see, and mostly use, the same data in any programming language. So you’re not popping it about all the time.

ProPublica: Do you think journalists risk making erroneous assumptions about the accuracy of data or drawing inappropriate conclusions, such as mistaking correlation for causation?

Wickham: One of the challenges of data is that if you can quantify something precisely, people interpret it as being more “truthy.” If you’ve got five decimal places of accuracy, people are more likely to just kind of “believe it” instead of questioning it. A lot of people forget that pretty much every dataset is collected by a person, or there are many people involved. And if you ignore that, your conclusions are going to possibly be fantastically wrong.

I was judging a data science poster competition, and one of the posters was about food safety and food inspection reports. And I … and this probably says something profound about me ... but I immediately think: “Are there inspectors who are taking bribes, and if there were, how would you spot that from the data?”

You shouldn’t trust the data until you’ve proven that it is trustworthy. Until you’ve got another independent way of backing it up, or you’ve asked the same question three different ways and you get the same answer three different times. Then you should feel like the data is trustworthy. But until you’ve understood the process by which the data has been collected and gathered ... I think you should be very skeptical. Your default position should be skepticism.

ProPublica: That’s a good fit for us.

read more...

New: You Can Now Search the Full Text of 3 Million Nonprofit Tax Records for Free

On Thursday, we launched a new feature for our Nonprofit Explorer database: The ability to search the full text of nearly 3 million electronically filed nonprofit tax filings sent to the IRS since 2011.

Nonprofit Explorer already lets researchers, reporters and the general public search for tax information from more than 1.8 million nonprofit organizations in the United States, as well as allowing users to search for the names of key employees and directors of organizations.

Now, users of our free database can dig deep and search for text that appears anywhere in a nonprofit’s tax records, as long as those records were filed digitally — which according to the IRS covers about two-thirds of nonprofit tax filings in recent years.

How can this be useful to you? For one, this feature lets you find organizations that gave grants to other nonprofits. Any nonprofit that gives grants to another must list those grants on its tax forms — meaning that you can research a nonprofit’s funding by using our search. A search for “ProPublica,” for example, will bring up dozens of foundations that have given us grants to fund our reporting (as well as a few filings that reference Nonprofit Explorer itself).

Just another example: When private foundations have investments or ownership interest in for-profit companies, they have to list those on their tax filings as well. If you want to research which foundations have investments in a company like ExxonMobil, for example, you can simply search for the company name and check which organizations list it as an investment.

The possibilities are nearly limitless. You can search for the names or addresses of independent contractors that made more than $100,000 from a nonprofit, you can search for addresses, keywords in mission statements or descriptions of accomplishments. You can even use advanced search operators, so for instance you can find any filing that mentions either “The New York Times,” “nytimes” or “nytimes.com” in one search.

The new feature contains every electronically filed Form 990, 990-PF and 990-EZ released by the IRS from 2011 to date. That’s nearly 3 million filings. The search does not include forms filed on paper.

So please, give this search a spin. If you write a story using information from this search, or you come across bugs or problems, drop us a line! We’re excited to see what you all do with this new superpower.

read more...

New Plugin Launch: Republication Tracker Tool

INN Labs is happy to announce our newest plugin, the Republication Tracker Tool.

The Republication Tracker Tool allows publishers to share their stories by other websites and then track engagement of those shared stories with Google Analytics. The technology behind this tracking is similar to ProPublica’s PixelPing.

Why Might You Want to Use This Plugin?

  • Grow your audience and pageviews: Other publishers and readers acquire and re-distribute your content with a Creative-Commons license.
  • Better republishing reporting: View what publishers that are republishing your content and analyze engagement.
  • Foster collaborations: Gather supporting data to build relationships with other publishers who may be republishing your content.

How Publishers Republish Your Content

A simple “Republish This Story” button is added to your posts through a WordPress widget. This enables your stories to be republished by other sites who may want to use it and then to track engagement of those republished stories via Google Analytics

Sample republication button (style can be customized).

Track Republished Posts in WordPress

Once one of your stories has been republished, you will easily be able to see how many times it has been republished, how many republished views it has, who has republished it, and the URL of where it was republished, all from the WordPress edit screen for that story.

Example of republication data in the edit screen of a WordPress post.

Track Republished Posts in Google Analytics

Another valuable feature of the Republication Tracker Tool is all of your republished post data is also tracked in your Google Analytics account. Once you have your Google Analytics ID configured in the Republication Tracker Tool settings, you will be able to log into Google Analytics and view who has republished your stories, who is republishing most of your stories, and more.

Example of republication data within Google Analytics.

More Information and Feedback

For more information about how the plugin works:

You can download the Republication Tracker Tool from the WordPress.org plugin repository or through your website’s WordPress plugin page.

The initial release of this plugin was made possible by valuable INN member testing and feedback. If your organization uses the plugin, please let us know and continue sending us suggestions for improvement. Thank you!

The Republication Tracker Tool is one of the many WordPress plugins maintained by INN Labs, the tech and product team at the Institute for Nonprofit News.

Announcing Version 1.0 of the Link Roundups Plugin

INN Labs is pleased to announce an important update to the Link Roundups plugin!

If you run a daily or weekly newsletter collecting headlines from around the state, region, or within a particular industry, the Link Roundups plugin will make it easier to build and feed your aggregation posts into MailChimp.

The Link Roundups plugin helps editors aggregate links from around the web and save them in WordPress as “Saved Links”. You can publish these curated links in a Link Roundup (more below), display Saved Links and Link Roundups in widgets and posts in your WordPress site, or push Link Roundups directly to subscribers via MailChimp. It's designed to replace scattered link-gathering workflows that may span email, Slack, Google Docs and spreadsheets and streamlines collaborations between different staffers.

Why might you want to use this plugin? Here are a few reasons:

  • It creates a single destination for collecting links and metadata
  • On sites that publish infrequently, it provides recently published (curated) content for your readers
  • Weekly roundup newsletters or posts are a great way to recap your own site's coverage and build and diversify your audience, which can increase donations

Saved Links

The central function of the Link Roundups plugin is the Saved Link. It's a way of storing links in your WordPress database, alongside metadata such as the link's title, source site, and your description of the link's contents.

A screenshot of the Saved Links interface, showing many saved links and their respective metadata: authors, links, descriptions, and tags.

Save to Site Bookmarklet

When WordPress 4.9 removed the "Press This" functionality, this plugin's bookmarklet broke. This release's updates to the Saved Links functionality include a renewal of the "Save to Site" bookmarklet, based off of the canonical Press This plugin's functions. If your site has the WordPress-maintained Press This plugin active, your site users will be able to generate new bookmarklets. We include instructions on how to use the bookmarklet in the latest release.

A screenshot of the "Save to Site" button and its copy button

Once you've accumulated a few Saved Links, you can display them on your site using the Saved Links Widget or start to create Link Roundups (see next).

Saved Links Widget

Common uses of this widget include "coverage from around the state" or "recommended reads" or "from our partners" links.

It's a good way to point your to expert coverage from newsrooms you partner with. With the ability to sort Saved Links by tag, you can easily filter a widget to only show a selection of all the links saved on your site. Here's how Energy News Network uses the widget:

A screenshot of the widget as it appears at Energy News Network, showing a selection of links from the last day.

Link Roundups

Link Roundups are one of the best ways to present Saved Links to your readers. Collect links with Saved Links, then create a Link Roundup post with the week's curated links. The person who assembles the Link Roundup doesn't have to deal with messy cut-and-paste formatting or composing blurbs — when your users create Saved Links, they're already adding headlines, blurbs, and sources.

Add some opening and closing text, and you're most of the way to having composed a morning or weekly news roundup.

Link Roundups are a custom post type with all the Classic Editor tools and an easy interface for creating lists of Saved Links. As a separate post type, they can be integrated into your site's standard lists of posts or kept separate in their own taxonomies. You don't have to integrate the roundups with your standard posts flow; it's why we provide a Link Roundups widget to fulfill your widget area needs.

MailChimp Integration

Link Roundups don't have to stay on your site. If you configure your site to connect to the MailChimp API and create a newsletter template with editable content areas, you can send a Link Roundup directly to MailChimp from WordPress.

From the Link Roundup editor, you can choose a mailing list, and create MailChimp campaign drafts, send test emails, and send drafted campaigns directly. If you'd rather open a draft campaign in MailChimp to finalize the copy, there's a handy link to your draft campaign.

A screenshot of a settings metabox: choose a campaign type of regular or text. Choose a list to send to: the Link Roundups Mailchimp Tools Test list, with the group "are they Ben" option chosen: "Ben". The campaign title will be "Test Title Three Title", the test subject will be "Test Title Three Subject", and the template will be "Link Roundups Test 2"
Here's the MailChimp settings for the Link Roundups campaign editor: Many of the controls that you'd want to use to create and send a draft campaign.

More information

For more information about how the plugin works, see the Largo guide for administrators, the plugin's documentation on GitHub, or drop by one of our weekly open office hours sessions with your questions. You can also reach us by email at support@inn.org.

If you already have the Link Roundups plugin installed, keep an eye out for an update notice in your WordPress dashboard. If you'd like to install it, download it from the WordPress.org plugin repository or through your site dashboard's plugin page.

This update was funded in part by Energy News Network and Fresh Energy, with additional funding thanks to the generous support of the Democracy Fund, Ethics and Excellence in Journalism Fund, Open Society Foundation, and the John S. and James L. Knight Foundation.

Link Roundups is one of the many WordPress plugins maintained by INN Labs, the tech and product team at the Institute for Nonprofit News.

The Ticket Trap: Front to Back

Millions of motorists in Chicago have gotten a parking ticket. So when we built The Ticket Trap — an interactive news application that lets people explore ticketing patterns across the city — we knew that we’d be building something that shines a spotlight on an issue that affects people from all walks of life.

But we had a more specific story we needed to tell.

At ProPublica Illinois, we’d been reporting on Chicago’s aggressive parking and vehicle compliance ticket system for months. Our stories revealed a system that disproportionately punishes black and low-income residents and generates millions of dollars every year for the city by pushing massive debt onto Chicago’s poorest residents — even sending thousands into bankruptcy.

So when we thought about building an interactive database that allows the public, for the first time, to see all 54 million tickets issued over the last two decades, we wanted to make sure users understood the findings of the overall project. That’s why we centered the user experience around the disparities in the system, such as which wards have the most ticket debt and which have been hit hardest because residents can’t pay.

The Ticket Trap is a way for users to see lots of different patterns in tickets and to see how their wards fit into the bigger picture. It also gives civically active folks tools for talking about the issue of fines imposed by the city and helps them hold their elected officials accountable for how the city imposes debt.

The project also gave us an opportunity to try a bunch of technical approaches that could help a small organization like ours develop sustainable news apps. Although we’re part of the larger ProPublica, I’m the only developer in the Illinois office, so I want to make careful choices that will help keep our “maintenance debt” — the amount of time future-me will need to spend keeping old projects up and running — low.

Managing and minimizing maintenance debt is particularly important to small organizations that hope to do ambitious digital work with limited resources. If you’re at a small organization, or are just looking to solve similar problems, read on: These tools might help you, too.

In addition to lowering maintenance debt, I also wanted the pages to load quickly for our readers and to cost us as little as possible to serve. So I decided to eliminate, as much as possible, having executable code running on a server just to load pages that rarely change. That decision required us to solve some problems.

The development stack was JAMstack, which is a static front-end client with microservices to handle the dynamic features.

The learning curve for these technologies is steep (don’t worry if you don’t know what it all means yet). And while there are lots of good resources to learn the components, it can still be challenging to put them all together.

So let’s start with how we designed the news app before descending into the nerdy lower decks of technical choices. Design Choices

The Ticket Trap focuses on wards, Chicago’s primary political divisions and the most relevant administrative geography. Aldermen don’t legislate much, but they have more power over ticketing, fines, punishments and debt collection policies than anyone except the mayor.

We designed the homepage as an animated, sortable list that highlights the wards, instead of a table or citywide map. Our hope was to encourage users to make more nuanced comparisons among wards and to integrate our analysis and reporting more easily into the experience.

The top of the interface provides a way to select different topics and then learn about what they mean and their implications before seeing how the wards compare. If you click on “What Happens if You Don’t Pay,” you’ll learn that unpaid tickets can trigger late penalties, but they can also lead to license suspensions and vehicle impoundments. Even though many people from vulnerable communities are affected by tickets in Chicago, they’re not always familiar with the jargon, which puts them at a disadvantage when trying to defend themselves. Empowering them by explaining some basic concepts and terms was an important goal for us.

Below the explanation of terms, we display some small cards that show you the location of each ward, the alderman who represents it, its demographic makeup and information about the selected topic. The cards are designed to be easy to “skim and dive” and to make visual comparisons. You can also sort the cards based on what you’d like to know.

We included some code in our pages to help us track how many people used different features. About 50 percent of visitors selected a new category at least once and 27 percent sorted once they were in a category. We’d like to increase those numbers, but it’s in line with engagement patterns we saw for our Stuck Kids interactive graphic and better than we did on the interactive map in The Bad Bet, so I consider it a good start.

For more ward-specific information, readers can also click through to a page dedicated to their ward. We show much of the same information as the cards but allow you to home in on exactly how your ward ranks in every category. We also added some more detail, such as a map showing where every ticket in your ward has been issued.

We decided against showing trends over time on ward pages because the overall trend in the number of tickets issued is too big and complex a subject to capture in simple forms like line charts. As interesting as that may have been, it would have been outside the journalistic goals of highlighting systemic injustices.

For example, here’s the trend over time for tickets in the 42nd Ward (downtown Chicago). It’s not very revealing. Is there an upward trend? Maybe a little. But the chart says little about the overall effect of tickets on people’s lives, which is what we were really after.

On the other hand, the distributions of seizures/suspensions and bankruptcy are very revealing and show clear groupings and large variance, so each detail page includes visualizations of these variables.

Looking forward, there’s more we can do with these by layering on more demographic information and adding visual emphasis.

One last point about the design of these pages: I’m not a “natural” designer and look to colleagues and folks around the industry for inspiration and help. I made a map of some of those influences to show how many people I learned from as I worked on the design elements:

These include ProPublica news applications developer Lena Groeger’s work on Miseducation, as well as NPR’s Book Concierge, first designed by Danny DeBelius and most recently by Alice Goldfarb. I worked on both and picked up some design ideas along the way. Helga Salinas, then an engagement reporting fellow at ProPublica Illinois, helped frame the design problems and provided feedback that was crucial to the entire concept of the site. Technical Architecture

The Ticket Trap is the first news app at ProPublica to take this approach to mixing “baked out” pages with dynamic features like search. It’s powered by a static site generator (GatsbyJS), a query layer (Hasura), a database (Postgres with PostGIS) and microservices (Serverless and Lambda).

Let’s break that down:

  • Front-end and site generator: GatsbyJS builds a site by querying for data and providing it to templates built in React that handle all display-layer logic, both the user interface and content.
  • Deployment and development tools: A simple Grunt-based command line interface for deploying and administrative tasks.
  • Data management: All data analysis and processing is done in Postgres. Using GNU Make, the database can be rebuilt at any time. The Makefile also builds map tiles and uploads them to Mapbox. Hasura provides a GraphQL wrapper around Postgres so that GatsbyJS can query it, and GraphQL is just a query language for APIs.
  • Search and dynamic services: Search is handled by a simple AWS Lambda function managed with Serverless that ferries simple queries to an RDS database.

It’s all a bit buzzword-heavy and trendy-sounding when you say it fast. The learning curve can be steep, and there’s been a persistent and sometimes persuasive argument that the complexity of modern Javascript toolchains and frameworks like React are overkill for small teams.

We should be skeptical of the tech du jour. But this mix of technologies is the real deal, with serious implications for how we do our work. I found that once I could put all the pieces together, there was significantly less complexity than when using MVC-style frameworks for news apps, in my view.

Front End and Site Generator

GatsbyJS provides data to templates (built as React components) that contain both UI logic and content.

The key difference here from frameworks like Rails is that instead of splitting up templates and the UI (the classic “change template.html then update app.js” pattern), GatsbyJS bundles them together using React components. In this model, you factor your code into small components that bundle data and interactivity together. For example, all the logic and interface for the address search is in a component called AddressSearch. This component can be dropped into the code anywhere we want to show an address search using an HTML-like syntax (<AddressSearch />) or even used in other projects.

We’ll skip over what I did here, which is best summed up by this Tweet:

lol pic.twitter.com/UCpQK131J6— Thomas Wilburn (@thomaswilburn) January 16, 2019

There are better ways to learn React than my subpar code.

GatsbyJS also gives us a uniform system for querying our data, no matter where it comes from. In the spirit of working backward, look at this simplified query snippet from the site’s homepage, which provide access to data about each ward’s demographics, ticketing summary data, responsive images with locator maps for each ward, site configuration and editable snippets of text from a Google spreadsheet.

export const query = graphql` query PageQuery { configYaml { slug title description } allImageSharp { edges { node { fluid(maxWidth: 400) { ...GatsbyImageSharpFluid } } } } allGoogleSheetSortbuttonsRow { edges { node { slug label description } } } iltickets { citywideyearly_aggregate { aggregate { sum { current_amount_due ticket_count total_payments } } } wards { ward wardDemographics { white_pct black_pct asian_pct latino_pct } wardMeta { alderman address city state zipcode ward_phone email } wardTopFiveViolations { violation_description ticket_count avg_per_ticket } wardTotals { current_amount_due current_amount_due_rank ticket_count ticket_count_rank dismissed_ticket_count dismissed_ticket_count_rank dismissed_ticket_count_pct dismissed_ticket_count_pct_rank … } } }

Seems like a lot, and maybe it is. But it’s also powerful, because it’s the precise shape of the JSON that will be available to our template, and it draws on a variety of data sources: A YAML config file kept under version control (configYAML), images from the filesystem processed for responsiveness (allImageSharp), edited copy from Google Sheets (allGoogleSheetSortbuttonsRow) and ticket data from PostgreSQL (iltickets).

And data access in your template becomes very easy. Look at this snippet:

iltickets { wards { ward wardDemographics { white_pct black_pct asian_pct latino_pct } } }

In our React component, accessing this data looks like:

{data.iltickets.wards.map( (ward, i) => ( <p>Ward {ward.ward} is {ward.wardDemographics.latino_pct}% Latino.</p> ) )}

Every other data source works exactly the same way. The simplicity and consistency help keep templates clean and clear to read.

Behind the scenes, Hasura, a GraphQL wrapper for Postgres, is stitching together relational database tables and serializing them as JSON to pull in the ticket data.

Data Management

Hasura

Hasura occupies a small role in this project, but without it, the project would be substantially more difficult. It’s the glue that lets us build a static site out of a large database, and it allows us to query our Postgres database with simple JSON-esque queries using GraphQL. Here’s how it works.

Let’s say I have a table called “wards” with a one-to-many relationship to a table called “ward_yearly_totals”. Assuming I’ve set up the correct foreign key relationships in Postgres, a query from Hasura would look something like:

wards { ward alderman wardYearlyTotals { year ticket_count } }

On the back end, Hasura knows how to generate the appropriate join and turn it into JSON.

This process was also critical in working out the data structure. I was struggling with this but I realized that I just needed to work backward. Because GraphQL queries are declarative, I simply wrote queries that described the way I wanted the data to be structured for the front end and worked backward to create the relational database structures to fulfill those queries.

Hasura can do all sorts of neat things, but even the most simple use case — serializing JSON out of a Postgres database — is quite compelling for daily data journalism work.

Data Loading

GNU Make powers the data loading and processing workflow. I’ve written about this before if you want to learn how to do this yourself.

There’s a Python script (with tests) that handles cleaning up unescaped quotes and a few other quirks of the source data. We also use the highly efficient Postgres COPY command to load the data.

The only other notable wrinkle is that our source data is split up by year. That gives us a nice way to parallelize the process and to load partial data during development to speed things up.

At the top of the Makefile, we have these years:

PARKINGYEARS = 1996 1997 1998 1999 2000 2001 2002 2003 2004 2005 2006 2007 2008 2009 2010 2011 2012 2013 2014 2015 2016 2017 2018

To load four years worth of data, processing in parallel across four processor cores looks like this:

PARKINGYEARS=”2015 2016 2017 2018" make -j 4 parking

Make, powerful as it is for filesystem-based workflows and light database work, has been more than a bit fussy when working so extensively with a database. Dependencies are hard to track without hacks, which means not all steps can be run without remembering and running prior steps. Future iterations of this project would benefit from either more clever Makefile tricks or a different tool.

However, being able to recreate the database quickly and reliably was a central tenet of this project, and the Makefile did just that.

Analysis and Processing for Display

To analyze the data and deliver it to the front end, we wrote a ticket loader (open sourced here) to use SQL queries to generate a series of interlinked views of the data. These techniques, which I learned from Joe Germuska when we worked together at the Chicago Tribune, are a very powerful way of managing a giant data set like the 54 million rows of parking ticket data used in The Ticket Trap.

The fundamental trick to the database structure is to take the enormous database of tickets and crunch it down into smaller tables that aggregate combinations of variables, then run all analysis against those tables.

Let’s take a look at an example. The query below groups by year and ward, along with several other key variables such as violation code. By grouping this way, we can easily ask questions like, “How many parking meter tickets were issued in the 3rd Ward in 2005?” Here’s what the summary query looks like:

create materialized view wardsyearly as select w.ward, p.violation_code, p.ticket_queue, p.hearing_disposition, p.year, p.unit_description, p.notice_level, count(ticket_number) as ticket_count, sum(p.total_payments) as total_payments, sum(p.current_amount_due) as current_amount_due, sum(p.fine_level1_amount) as fine_level1_amount from wards2015 w join blocks b on b.ward = w.ward join geocodes g on b.address = g.geocoded_address join parking p on p.address = g.address where g.geocode_accuracy > 0.7 and g.geocoded_city = 'Chicago' and ( g.geocode_accuracy_type = 'range_interpolation' or g.geocode_accuracy_type = 'rooftop' or g.geocode_accuracy_type = 'intersection' or g.geocode_accuracy_type = 'point' or g.geocode_accuracy_type = 'ohare' ) group by w.ward, p.year, p.notice_level, p.unit_description, p.hearing_disposition, p.ticket_queue, p.violation_code;

The virtual table created by this view looks like this:

This is very easy to query and reason about, and significantly faster than querying the full parking data set.

Let’s say we want to know how many tickets were issued by the Chicago Police Department in the 1st Ward between 2013 and 2017:

select sum(ticket_count) as cpd_tickets from wardsyearly where ward = '1' and year >= 2013 and year <= 2017 and unit_description = 'CPD'

The answer is 64,124 tickets. This query took 119 milliseconds on my system when I ran it, while a query to obtain the equivalent data from the raw parking records takes minutes rather than fractions of a second.

The Database as the “Single Source of Truth”

I promised myself when I started this project that all calculations and analysis would be done with SQL and only SQL. That way, if there's a problem with the data in the front end, there's only one place to look, and if there's a number displayed in the front end, the only transformation it undergoes is formatting. There were moments when I wondered if this was crazy, but it has turned out to be perhaps my best choice in this project.

With common table expressions (CTE), part of most SQL environments, I was able to do powerful things with a clear, if verbose, syntax. For example, we rank and bucket every ward by every key metric in the data. Without CTEs, this would be a task best accomplished with some kind of script with gnarly for-loops or impenetrable map/reduce functions. With CTEs, we can use impenetrable SQL instead! But at least our workflow is declarative and ensures any display of the data can and should contain no additional data processing.

Here’s an example of a CTE that ranks wards on a couple of variables using the intermediate summary view from above. Our real queries are significantly more complex, but the fundamental concepts are the same:

with year_bounds as ( select 2013 as min_year, 2017 as max_year ), wards_toplevel as ( select ward, sum(ticket_count) as ticket_count, sum(total_payments) as total_payments, from wardsyearly, year_bounds where (year >= min_year and year <= max_year) group by ward ) select ward, ticket_count, dense_rank() over (order by ticket_count desc) as ticket_count_rank, total_payments, dense_rank() over (order by total_payments desc) as total_payments_rank from wards_toplevel;

Geocoding

Geocoding the data — turning handwritten or typed addresses into latitude and longitude coordinates — was a critical step in our process. The ticket data is fundamentally geographic and spatial. Where a ticket is issued is of utmost importance for analysis. Because the input addresses can be unreliable, the address data associated with tickets was exceptionally messy. Geocoding this data was a six-month, iterative process.

An important technique we use to clean up the data is very simple. We “normalize” the addresses to the block level by turning street numbers like “1432 N. Damen” into “1400 N. Damen.” This gives us fewer addresses to geocode, which made it easier to repeatedly geocode some or all of the addresses. The technique doesn’t improve the data quality itself, but it makes the data significantly easier to work with.

Ultimately, we used Geocodio and were quite happy with it. Google's geocoder is still the best we've used, but Geocodio is close and has a more flexible license that allowed us to store, display and distribute the data, including in our Data Store.

We found that the underlying data was hard to manually correct because many of the errors were because of addresses that were truly ambiguous. Instead, we simply accepted that many addresses were going to cause problems. We omitted addresses that Geocodio wasn't confident about or couldn't pinpoint with enough accuracy. We then sampled and tested the data to find the true error rate.

About 12 percent of addresses couldn’t be used. Of the remaining addresses, sampling showed them to be about 94 percent accurate. The best we could do was make the most conservative estimates and try to communicate and disclose this clearly in our methodology.

To improve accuracy, we worked with Matt Chapman, a local civic hacker, who had geocoded the addresses without normalization using another service called SmartyStreets. We shared data sets and cross-validated our results. SmartyStreets’ accuracy was very close to Geocodio's. I attempted to see if there was a way to use results from both services. Each service did well and struggled with different types of address problems, so I wanted to know if combining them would increase the overall accuracy. In the end, my preliminary experiments revealed this would be technically challenging with negligible improvement. Deployment and Development Tools

The rig uses some simple shell commands to handle deployment and building the database. For example:

make all make db grunt publish grunt unpublish grunt publish --target=production Dynamic Search With Microservices

Because we were building a site with static pages and no server runtime, we had to solve the problem of offering a truly dynamic search feature. We needed to provide a way for people to type in an address and find out which ward that address is in. Lots of people don’t know their own wards or aldermen. But even when they do, there’s a decent chance they wouldn’t know the ward for a ticket they received elsewhere in the city.

To allow searching without needing to spin up any new services, we used Mapbox's autocomplete geocoder, AWS Lambda, to provide a tiny API, our Amazon Aurora database and Serverless to manage the connection.

Mapbox provides suggested addresses, and when the user clicks on one, we dispatch a request to the back-end service with the latitude and longitude, which are then run through a simple point-in-polygon query to determine the ward.

It’s simple. We have a serverless.yml config file that looks like this:

service: il-tickets-query plugins: - serverless-python-requirements - serverless-dotenv-plugin custom: pythonRequirements: dockerizePip: non-linux zip: true provider: name: aws runtime: python3.6 stage: ${opt:stage,'dev'} environment: ILTICKETS_DB_URL: ${env:ILTICKETS_DB_URL} vpc: securityGroupIds: - sg-XXXXX subnetIds: - subnet-YYYYY package: exclude: - node_modules/**

functions: ward: handler: handler.ward events: - http: method: get cors: true path: ward request: parameters: querystrings: lat: true lng: true

Then we have a handler.py file to execute the query:

try: import unzip_requirements except ImportError: pass import json import logging import numbers import os import records log = logging.getLogger() log.setLevel(logging.DEBUG) DB_URL = os.getenv('ILTICKETS_DB_URL')

def ward(event, context): qs = event["queryStringParameters"] db = records.Database(DB_URL) rows = db.query(""" select ward from wards2015 where st_within(st_setsrid(ST_GeomFromText('POINT(:lng :lat)'), 3857), wkb_geometry) """, lat=float(qs['lat']), lng=float(qs['lng']))

wards = [row['ward'] for row in rows]

if len(wards): response = { "statusCode": 200, "body": json.dumps({"ward": wards[0]}), "headers": { "Access-Control-Allow-Origin": "projects.propublica.org", } } else: response = { "statusCode": 404, "body": "No ward found", }

return response

That’s all there is to it. There are plenty of ways it could be improved, such as making the cross-origin resource sharing policies configurable based on the deployment stage. We’ll also be adding API versioning soon to make it easier to maintain different site versions. Minimizing Costs, Maximizing Productivity

The cost savings of this approach can be significant.

Using Amazon Lambda cost pennies per month (or less), while running even the smallest servers on Amazon’s Elastic Compute Cloud service usually costs quite a bit more. The thousands of requests and tens of thousands of milliseconds of computing time used by the app in this example are, by themselves, well within Amazon’s free tier. Serving static assets from Amazon’s S3 service also costs only pennies per month.

Hosting costs are a small part of the puzzle, of course — developer time is far more costly, and although this system may take longer up front, I think the trade-off is worth it because of the decreased maintenance burden. The time a developer will not have to spend maintaining a Rails server is time that he or she can spend reporting or writing new code.

For The Ticket Trap app, I only need to worry about a single, highly trusted and reliable service (our database) rather than a virtual server that needs monitoring and could experience trouble.

But where this system really shines is in its increased resiliency. When using traditional frameworks like Rails or Django, functionality like search and delivering client code are tightly coupled. So if the dynamic functionality breaks, the whole site will likely go down with it. In this model, even if AWS Lambda were to experience problems (which would likely be part of a major, internet-wide event), the user experience would be degraded because search wouldn’t work, but we wouldn’t have a completely broken app. Decoupling the most popular and engaging site features from an important but less-used feature minimizes the risks in case of technical difficulties.

If you’re interested in trying this approach, but don’t know where to begin, identify what problem you’d like to spend less time on, especially after your project is launched. If running databases and dynamic services is hard or costly for you or your team, try playing with Serverless and AWS Lambda or a similar provider supported by Serverless. If loading and checking your data in multiple places always slows you down, try writing a fast SQL-based loader. If your front-end code is always chaotic by the end of a development cycle, look into implementing the reactive pattern provided by tools like React, Svelte, Angular, Vue or Ractive. I learned each part of this stack one at a time, always driven by need.

read more...

Want to Start a Collaborative Journalism Project? We’re Building Tools to Help.

Today we’re announcing new tools, documentation and training to help news organizations collaborate on data journalism projects.

Newsrooms, long known for being cutthroat competitors, have been increasingly open to the idea of working with one another, especially on complex investigative stories. But even as interest in collaboration grows, many journalists don’t know where to begin or how to run a sane, productive partnership. And there aren’t many good tools available to help them work together. That’s where our project comes in.

Get the latest news from ProPublica every afternoon.

We’ll be sharing some of the software we built, and the lessons we learned, while creating our Documenting Hate project, which tracks hate crimes and bias-motivated harassment in the U.S.

The idea to launch Documenting Hate came shortly after Election Day 2016, in response to a widely reported uptick in hate incidents. Because data collection on hate crimes and incidents is so inadequate, we decided to ask people across the country to tell us their stories about experiencing or witnessing them. Thousands of people responded. To cover as many of their stories as we could, we organized a collaborative effort with local and national newsrooms, which eventually included more than 160 of them.

We’ll be building out and open-sourcing the tools we created to do Documenting Hate, as well as our Electionland project, and writing a detailed how-to guide that will let any newsroom do crowd-powered data investigations on any topic.

Even newsrooms without dedicated developers will be able to launch a basic shared investigation, including gathering tips from the public through a web-based form and funneling those tips into a central database that journalists can use to find stories and sources. Newsrooms with developers will be able to extend the tools to enable collaboration around any data sets.

We’ll also provide virtual trainings about how to use the tools and how to plan and launch crowd-powered projects around shared data sets.

This work will be a partnership with the Google News Initiative, which is providing financial support.

Launched in January 2017, ProPublica’s Documenting Hate project is a collaborative investigation of hate crimes and bias incidents in the United States. The Documenting Hate coalition is made up of more than 160 newsrooms and several journalism schools that collect tips from the public and records from police to report on hate. Together we’ve produced close to 200 stories. That work will continue in 2019.

We’re already hard at work writing a how-to guide on collaborative, crowd-powered data projects. We’ll be talking about it at the 2019 NICAR conference in Newport Beach, California, in March. We are also hiring a contract developer to work on this; read the job description and apply here.

The first release of the complete tools and playbook will be available this summer, and online trainings will take place in the second half of the year.

There are a thousand different ways to collaborate around shared data sets. We want to hear from you about what would be useful in our tool, and we’re interested in hearing from newsrooms that might be interested in testing our tools. Sign up for updates here.

read more...

Chasing Leads and Herding Cats: Shaping a New Role in the Newsroom

In this ever-changing industry, new roles are emerging that redefine how we do journalism: audience engagement director, social newsgathering reporter, Snapchat video producer. At ProPublica, I’ve been part of developing a new role for our newsroom. My title is partner manager, and I lead a large-scale collaboration: Documenting Hate, an investigative project to track and report on hate crimes and bias incidents.

ProPublica regularly collects large amounts of information that we can’t process by ourselves, including documents gathered in our reporting, tips solicited by our engagement journalists, and data published in our news applications.

Get the latest news from ProPublica every afternoon.

Since the beginning, we’ve seen collaboration as a key way to make sure that all of this reporting material can be used to fulfill our mission: to make an impact in the real world. Collaboration has been a fundamental part of ProPublica’s journalism model. We make our stories available to republish for free through Creative Commons and usually co-publish or co-report stories with other news outlets. When it comes to large data sets, we often offer up our findings to journalists or the public to enable new reporting. It’s a way of spreading the wealth, so to speak. Collaborations are typically a core responsibility of each editor in the newsroom, but some of our projects have large-scale collaborations at their center, and they require dedicated and sustained attention.

My role emerged after Electionland 2016, one of the largest-ever journalism collaborations, which many ProPublica staff members pitched in to organize. While the project was a journalistic success, its editors learned a key lesson about the need for somebody to own the relationship with partner newsrooms. In short, we came to think that the collaboration itself was something that needed editing, including recruiting partners, making sure they saw the reporting tips they needed to see, and tracking what partners were publishing. It also reinforced the need for a more strategic tip-sharing approach after the success of large engagement projects, like Lost Mothers and Agent Orange, which garnered thousands of leads — and more stories than we had time to tell.

That’s how my role was born. Soon after the 2016 election, ProPublica launched Documenting Hate. Hiring a partner manager was the first priority. We also hired a partner manager to work on Electionland 2018, which will cover this year’s midterm elections.

Our newsroom isn’t alone in dedicating resources to this type of role. Other investigative organizations, such as Reveal from the Center for Investigative Reporting and the International Consortium of Investigative Journalists, staffed up to support their collaborations. Heather Bryant — who founded Project Facet, which helps newsrooms work together — told me there are at least 10 others who manage long-term collaborations at newsrooms across the country, from Alaska, to Texas, to Pennsylvania. What I Do

My job is a hybrid of roles: reporter, editor, researcher, social media producer, recruiter, trainer and project manager.

I recruited our coalition of newsrooms, and I vet and onboard partners. To date, we have more than 150 national and local newsrooms signed on to the project, plus nearly 20 college newspapers. I speak to a contact at each newsroom before they join, and then I provide them with the materials they need to work on the project. I’ve written training materials and conduct online training sessions so new partners can get started more quickly.

The core of this project is a shared database of tips about hate incidents that we source from the public. For large collaborations like Documenting Hate and Electionland, our developer Ken Schwencke builds these private central repositories, which are connected directly to our tip submission form. We use Screendoor, a form-building service, to host the tip form.

In large-scale collaborations, we invite media organizations to be part of the newsgathering process. For Documenting Hate, we ask partners to embed this tip submission form to help us gather story leads. That way, we can harness the power of different audiences around the country, from Los Angeles Times readers, to Minnesota Public Radio listeners, to Univision viewers. At ProPublica, we try to talk about the project as much as we can in the media and at conferences to spread the word to both potential tipsters and partners.

The tips we gather are available to participating journalists — helping them to do their job and produce stories they might otherwise not have found. ProPublica and our partners have reported more than 160 stories, including pieces about hate in schools, on public transportation and on the road, in the workplace, and at places of worship, and incidents involving the president’s name and policies, to name just a few. Plus, each authenticated tip acts as a stepping stone for other partners to build on their reporting.

At ProPublica, we’ve been gathering lots of public records from police on hate crimes to do our own reporting and sharing those records with partners, too. Any time we produce an investigation in-house, I share the information we have available so reporters can republish or localize the story.

As partner manager, I’m a human resource to share knowledge. I’ve built expertise in the hate beat and serve as a kind of research desk for our network, pointing reporters to sources and experts. I host a webinar or training once a month to help reporters understand the project or to build this beat, and I send out a weekly internal newsletter.

Another part of my job is being an air-traffic controller, sending out incoming tips to reporters who might be interested and making sure that multiple people aren’t working on the same tip at the same time. This is especially important in a project like ours; given the sensitivity of the subject, we don’t want to scare off tipsters by having multiple reporters reach out at once. I pitch story ideas based on patterns I’ve identified to journalists who might want to dig further. I’m constantly researching leads to share with our network and with specific journalists working on relevant stories.

And I’m also a signal booster: When partners publish reporting on hate, we share their work on our social channels to make sure these stories get as big an audience as possible. We keep track of all of the stories that were reported with sourcing from the project to make them available in one place. The Challenges

While the Documenting Hate project has produced some incredible work, this is not an easy job.

Many journalists are eager to work with ProPublica, but not always with each other; it can be a process to get buy-in from editors to collaborate with a network of newsrooms, especially at large ones where there are layers of hierarchy. Some reporters agree to join but don’t make it all the way through onboarding, which involves several steps that may require help from others in their newsrooms. Some explore the database and don’t see anything they want to follow up on right away, and then lose interest. And occasionally journalists are so overwhelmed with their day-to-day work that I rarely hear back from them after they’ve joined.

Turnover and layoffs, which are depressingly common in our industry, mean having to find and onboard new contacts in partner newsrooms, or relying on bounce-back emails to figure out who’s left. It also means that sometimes engaged reporters move into positions at new companies where they don’t cover hate, leaving a gap in their old newsrooms. A relentless news cycle doesn’t help, either. For example, after the 2017 violence in Charlottesville, Virginia, caused a renewed surge in interest in the hate beat, a series of deadly hurricanes hit, drawing a number of reporters onto the natural disaster beat for a time.

And because of the sensitivity of the incidents, tipsters sometimes refuse to talk after they’ve written in, which can be discouraging for reporters. Getting a story may mean following up on a dozen tips rather than just one or two. Luckily, since we’ve received thousands of tips and hundreds of records, active participants in our coalition have found plenty of material to work on. The Future of Partnerships

While collaborations aren’t always easy, I believe projects like Documenting Hate are likely to be an important part of the future of journalism. Pooling resources and dividing and conquering on reporting can help save time and money, which are in increasingly short supply.

Some partnerships are the fruit of necessity, linking small newsrooms in the same region or state, like Coast Alaska, or creating stronger ties between affiliates within a large network, like NPR. I think there’s huge potential for more local collaborations, especially with shrinking budgets and personnel. Other partnerships emerge out of opportunity, like the Panama Papers investigation, which was made possible by a massive document leak. If more newsrooms resisted the urge for exclusivity — a concept that matters far more to journalists than to the public — more partnerships could be built around data troves and leaks.

Another area of potential is to band together to request and share public records or to pool funding for more expensive requests; these costs can prevent smaller newsrooms from doing larger investigations. I also think there’s a ton of opportunity to collaborate on specific topics and beats to share knowledge, best practices and reporting.

With new partnerships comes the need for someone at the helm, navigating the ship. While many newsrooms’ finances are shrinking, any collaborative project can have a coordinator role baked into the budget. An ideal collaborations manager is a journalist who understands the day-to-day challenges of newsrooms, is fanatical about project management, is capable of sourcing and shaping stories, and can track the reach and impact of work that’s produced.

We all benefit when we work together — helping us reach wider audiences, do deeper reporting and better serve the public with our journalism.

read more...

New Partnership Will Help Us Hold Facebook and Campaigns Accountable

We launched a new collaboration on Monday that will make it even easier to be part of our Facebook Political Ad Collector project.

In case you don’t know, the Political Ad Collector is a project to gather targeted political advertising on Facebook through a browser extension installed by thousands of users across the country. Those users, whose data is gathered completely anonymously, help us build a database of micro-targeted political ads that help us hold Facebook and campaigns accountable.

On Monday, Mozilla, maker of the Firefox web browser, is launching the Firefox Election Bundle, a special election-oriented version of the browser. It comes pre-installed with ProPublica’s Facebook Political Ad Collector and with an extension Mozilla created called Facebook Container.

The Facebook Container, according to Mozilla, helps users control what data Facebook collects about their browsing habits when they visit sites other than Facebook.

People who choose to download the Firefox Election Bundle will automatically begin participating in the Facebook Political Ad Collector project and will also benefit from the extra privacy controls that come with the Facebook Container project. The regular version of Firefox is, of course, still available.

Think of it as turning the tables. Instead of Facebook watching you, you can maintain control over what Facebook can see while helping keep an eye on Facebook’s ads.

You can download the Firefox Election Bundle here.

If you use Firefox and already have the Facebook Political Ad Collector installed, you can install Mozilla’s Facebook Container add-on here.

If you want to find out more about the Facebook Political Ad Collector project, you can read this story or browse the ads we’ve already collected.

read more...

The Election DataBot: Now Even Easier

We launched the Election DataBot in 2016 with the idea that it would help reporters, researchers and concerned citizens more easily find and tell some of the thousand stories in every political campaign. Now we’re making it even easier.

Just as before, the DataBot is a continuously updating feed of campaign data, including campaign finance filings, changes in race ratings and deleted tweets. You can watch the data come in in real time or sign up to be notified by email when there’s new data about races you care about.

DataBot’s new homepage dashboard of campaign activity now includes easy-to-understand summaries so that users can quickly see where races are heating up. We’ve added a nationwide map that shows you where a variety of campaign activity is occurring every week.

For example, the map shows that both leading candidates in Iowa’s 1st District saw spikes in Google searches in the week ending on Sept. 16 (we track data from Monday to Sunday). The Cook Political Report, which rates House and Senate races, changed its rating of that race from “Tossup” to “Lean Democratic” on Sept. 6.

When super PACs spend a lot of money in a House or Senate race, you’ll see it on the map. When Google search traffic spikes for a candidate, that’ll show up, too. We’re also tracking statements by incumbent members of Congress and news stories indexed by Google News. So when you get an email alerting you to new activity (you did sign up for alerts, right?), you can see at a glance the level of activity in the race.

The new homepage also allows you to look back in time to see how campaign activity has changed during the past 15 weeks, and whether what you’re seeing this week is really different than it was before. We’ve also added a way to focus on the races rated the most competitive by the Cook Political Report.

In order to highlight the most important activity, we weighted activity by type. Independent expenditures — where party committees and outside interest groups are choosing to spend their money — count twice as much as other types of activity.

Instead of state-level presidential election forecasts, we now are tracking changes to FiveThirtyEight’s “classic” forecast for each House and Senate contest. We’ve also added candidate statements for more than 500 campaigns whose websites produce a feed of their content.

The homepage map is just the first step in a more useful experience for DataBot users. We’ll be adding other layers of summary data, including details on social media activity, to the homepage, and additional ways to see how races have changed based on the activity feeds.

We’ll also be working to make the individual firehose item descriptions more useful; for example, saying whether a campaign finance filing has the most money raised or spent for that candidate compared with other reports.

We’d love to hear from you about ways to make Election DataBot more useful as Nov. 6 approaches.

read more...

Shedding Some Light on Dark Money Political Donors

On Wednesday we added details to our FEC Itemizer database on nearly $763 million in contributions to the political nonprofit organizations — also known as 501(c)(4) groups — that have spent the most money on federal elections during the past eight years. The data is courtesy of Issue One, a nonpartisan, nonprofit advocacy organization that is dedicated to political reform and government ethics.

These contributions often are called “dark money” because political nonprofits are not required to disclose their donors and can spend money supporting or opposing political candidates. By using government records and other publicly available sources, Issue One has compiled the most comprehensive accounting of such contributions to date.

To compile the data, Issue One identified the 15 political nonprofits that reported spending the most money in federal elections since the Supreme Court decision in Citizens United v. FEC in early 2010. It then found contributions using corporate filings, nonprofit reports and documents from the Internal Revenue Service, Department of Labor and Federal Election Commission. One of the top-spending political nonprofits, the National Association of Realtors, is almost entirely funded by its membership and has no records in this data.

Get info about new and updated data from ProPublica.

For each contribution, you can see the source document detailing the transaction in FEC Itemizer.

The recipients are a who’s who of national political groups: Americans for Prosperity, the National Rifle Association Institute for Legislative Action, the U.S. Chamber of Commerce and Planned Parenthood Action Fund Inc. account for more than half of the $763 million in contributions in the data. There’s also American Encore, formerly the Center to Protect Patient Rights, one of the main conduits for the conservative financial network created by Charles and David Koch.

The largest donor is the Freedom Partners Chamber of Commerce, a Koch-organized business association that has contributed at least $181 million to the leading political nonprofits. Other donors include the Susan Thompson Buffett Foundation, which has given at least $25 million to the Planned Parenthood Action Fund, and major labor unions like the American Federation of State, County and Municipal Employees, or AFSCME, which has given at least $2.8 million to Democratic political nonprofit organizations.

Also among the donors are major corporations like Dow Chemical (mostly giving to the U.S. Chamber of Commerce), gun manufacturers (to the NRA), 501(c)(3) charities and individuals.

You can read Issue One’s report on its work as well as its methodology for discovering the contribution records. Because many of the sources are documents that are filed annually, this data won’t be updated the same way that FEC Itemizer is for campaign finance filings, but it represents the most comprehensive collection of dark money contributions to date.

read more...

Download Chicago’s Parking Ticket Data Yourself

ProPublica Illinois has been reporting all year on how ticketing in Chicago is pushing tens of thousands of drivers into debt and hitting black and low-income motorists the hardest. Last month, as part of a collaboration with WBEZ, we reported on how a city decision to raise the cost of citations for not having a required vehicle sticker has led to more debt — and not much more revenue.

We were able to tell these stories, in part, because we obtained the city of Chicago’s internal database for tracking parking and vehicle compliance tickets through a Freedom of Information request jointly filed by both news organizations. The records start in 2007, and they show you details on when and where police officers, parking enforcement aides, private contractors and others have issued millions of tickets for everything from overstaying parking meters to broken headlights. The database contains nearly 28.3 million tickets. Altogether, Chicago drivers still owe a collective $1 billion for these tickets, including late penalties and collections fees.

Now you can download the data yourself; we’ve even made it easier to import. We’ve anonymized the license plates to protect the privacy of drivers. As we get more records, we’ll update the data.

We’ve found a number of stories hidden in this data, including the one about city sticker tickets, but we’re confident there are more. If you see something interesting, email us. Or if you use the data for a project of your own — journalistic or otherwise — tell us. We’d love to know.

read more...

How ProPublica Illinois Uses GNU Make to Load 1.4GB of Data Every Day

I avoided using GNU Make in my data journalism work for a long time, partly because the documentation was so obtuse that I couldn’t see how Make, one of many extract-transform-load (ETL) processes, could help my day-to-day data reporting. But this year, to build The Money Game, I needed to load 1.4GB of Illinois political contribution and spending data every day, and the ETL process was taking hours, so I gave Make another chance.

Now the same process takes less than 30 minutes.

Here’s how it all works, but if you want to skip directly to the code, we’ve open-sourced it here.

Fundamentally, Make lets you say:

  • File X depends on a transformation applied to file Y
  • If file X doesn’t exist, apply that transformation to file Y and make file X

This “start with file Y to get file X” pattern is a daily reality of data journalism, and using Make to load political contribution and spending data was a great use case. The data is fairly large, accessed via a slow FTP server, has a quirky format, has just enough integrity issues to keep things interesting, and needs to be compatible with a legacy codebase. To tackle it, I needed to start from the beginning. Overview

The financial disclosure data we’re using is from the Illinois State Board of Elections, but the Illinois Sunshine project had released open source code (no longer available) to handle the ETL process and fundraising calculations. Using their code, the ETL process took about two hours to run on robust hardware and over five hours on our servers, where it would sometimes fail for reasons I never quite understood. I needed it to work better and work faster.

The process looks like this:

  • Download data files via FTP from Illinois State Board Of Elections.
  • Clean the data using Python to resolve integrity issues and create clean versions of the data files.
  • Load the clean data into PostgreSQL using its highly efficient but finicky “\copy” command.
  • Transform the data in the database to clean up column names and provide more immediately useful forms of the data using “raw” and “public” PostgreSQL schemas and materialized views (essentially persistently cached versions of standard SQL views).

The cleaning step must happen before any data is loaded into the database, so we can take advantage of PostgreSQL’s efficient import tools. If a single row has a string in a column where it’s expecting an integer, the whole operation fails.

GNU Make is well-suited to this task. Make’s model is built around describing the output files your ETL process should produce and the operations required to go from a set of original source files to a set of output files.

As with any ETL process, the goal is to preserve your original data, keep operations atomic and provide a simple and repeatable process that can be run over and over.

Let’s examine a few of the steps: Download and Pre-import Cleaning

Take a look at this snippet, which could be a standalone Makefile:

data/download/%.txt : aria2c -x5 -q -d data/download --ftp-user="$(ILCAMPAIGNCASH_FTP_USER)" --ftp-passwd="$(ILCAMPAIGNCASH_FTP_PASSWD)" ftp://ftp.elections.il.gov/CampDisclDataFiles/$*.txt

data/processed/%.csv : data/download/%.txt python processors/clean_isboe_tsv.py $< $* > $@

This snippet first downloads a file via FTP and then uses Python to process it. For example, if “Expenditures.txt” is one of my source data files, I can run make data/processed/Expenditures.csv to download and process the expenditure data.

There are two things to note here.

The first is that we use Aria2 to handle FTP duties. Earlier versions of the script used other FTP clients that were either slow as molasses or painful to use. After some trial and error, I found Aria2 did the job better than lftp (which is fast but fussy) or good old ftp (which is both slow and fussy). I also found some incantations that took download times from roughly an hour to less than 20 minutes.

Second, the cleaning step is crucial for this dataset. It uses a simple class-based Python validation scheme you can see here. The important thing to note is that while Python is pretty slow generally, Python 3 is fast enough for this. And as long as you are only processing row-by-row without any objects accumulating in memory or doing any extra disk writes, performance is fine, even on low-resource machines like the servers in ProPublica’s cluster, and there aren’t any unexpected quirks. Loading

Make is built around file inputs and outputs. But what happens if our data is both in files and database tables? Here are a few valuable tricks I learned for integrating database tables into Makefiles:

One SQL file per table / transform: Make loves both files and simple mappings, so I created individual files with the schema definitions for each table or any other atomic table-level operation. The table names match the SQL filenames, the SQL filenames match the source data filenames. You can see them here.

Use exit code magic to make tables look like files to Make: Hannah Cushman and Forrest Gregg from DataMade introduced me to this trick on Twitter. Make can be fooled into treating tables like files if you prefix table level commands with commands that emit appropriate exit codes. If a table exists, emit a successful code. If it doesn’t, emit an error.

Beyond that, loading consists solely of the highly efficient PostgreSQL \copy command. While the COPY command is even more efficient, it doesn’t play nicely with Amazon RDS. Even if ProPublica moved to a different database provider, I’d continue to use \copy for portability unless eking out a little more performance was mission-critical.

There’s one last curveball: The loading step imports data to a PostgreSQL schema called raw so that we can cleanly transform the data further. Postgres schemas provide a useful way of segmenting data within a single database — instead of a single namespace with tables like raw_contributions and clean_contributions, you can keep things simple and clear with an almost folder-like structure of raw.contributions and public.contributions. Post-import Transformations

The Illinois Sunshine code also renames columns and slightly reshapes the data for usability and performance reasons. Column aliasing is useful for end users and the intermediate tables are required for compatibility with the legacy code.

In this case, the loader imports into a schema called raw that is as close to the source data as humanly possible.

The data is then transformed by creating materialized views of the raw tables that rename columns and handle some light post-processing. This is enough for our purposes, but more elaborate transformations could be applied without sacrificing clarity or obscuring the source data. Here’s a snippet of one of these view definitions:

CREATE MATERIALIZED VIEW d2_reports AS SELECT id as id, committeeid as committee_id, fileddocid as filed_doc_id, begfundsavail as beginning_funds_avail, indivcontribi as individual_itemized_contrib, indivcontribni as individual_non_itemized_contrib, xferini as transfer_in_itemized, xferinni as transfer_in_non_itemized, # …. FROM raw.d2totals WITH DATA;

These transformations are very simple, but simply using more readable column names is a big improvement for end-users.

As with table schema definitions, there is a file for each table that describes the transformed view. We use materialized views, which, again, are essentially persistently cached versions of standard SQL views, because storage is cheap and they are faster than traditional SQL views. A Note About Security

You’ll notice we use environment variables that are expanded inline when the commands are run. That’s useful for debugging and helps with portability. But it’s not a good idea if you think log files or terminal output could be compromised or people who shouldn’t know these secrets have access to logs or shared systems. For more security, you could use a system like the PostgreSQL pgconf file and remove the environment variable references. Makefiles for the Win

My only prior experience with Make was in a computational math course 15 years ago, where it was a frustrating and poorly explained footnote. The combination of obtuse documentation, my bad experience in school and an already reliable framework kept me away. Plus, my shell scripts and Python Fabric/Invoke code were doing a fine job building reliable data processing pipelines based on the same principles for the smaller, quick turnaround projects I was doing.

But after trying Make for this project, I was more than impressed with the results. It’s concise and expressive. It enforces atomic operations, but rewards them with dead simple ways to handle partial builds, which is a big deal during development when you really don’t want to be repeating expensive operations to test individual components. Combined with PostgreSQL’s speedy import tools, schemas, and materialized views, I was able to load the data in a fraction of the time. And just as important, the performance of the new process is less sensitive to varying system resources.

If you’re itching to get started with Make, here are a few additional resources:

In the end, the best build/processing system is any system that never alters source data, clearly shows transformations, uses version control and can be easily run over and over. Grunt, Gulp, Rake, Make, Invoke … you have options. As long as you like what you use and use it religiously, your work will benefit.

read more...

Weekly readings for #pubmedia, 5 Mar 2018and, a change in direction

Hello friends – I’ve had this blog since 2003, but for the past three years it has been largely used to share links of interest to the public media community that I’d posted to my @haarsager Twitter feed.  This link sharing actually dates from 1997, when I started to share them to an email list.  So, for nearly 21 years, the value to me in all this has been as a discipline to force me to keep up on industry developments.  I’m going to keep doing that, but putting this compilation together takes an additional hour per week.  I’d rather use that time to do some related writing, which I intend to have appear here in place of these links, though most of them will be inspired by the reading I will continue to do.  Thanks for the nice notes I’ve received from many of you about this weekly effort. 

For now, here is the last compilation.  You can continue to get these in “real time” from <http://www.twitter.com/haarsager>.  --Dennis

ATSC 3.0/HbbTV

  • Public TV urges FCC to exempt stations from ATSC 3.0 simulcasting rules.  Current

Broadband/Wireless

  • FCC’s new broadband map paints an irresponsibly inaccurate picture of American broadband.  Vice Motherboard

Cable/Satellite TV/MVPD/Pay-TV/Cord-Cutting

  • U.S. cable, satellite, telcoTV lost 3.5M subs in 2017.  nScreenMedia

Digital Video/OTT/VOD

  • Pay streaming households to reach 450M mark by 2022.  Rapid TV News
  • vMVPD customer base reaches 4.6M, but has only captured a third of cord cutters.  FierceCable

Journalism

  • must read  ‘It’s going to end in tears’: Reality check is coming for subscription-thirsty publishers.  Digiday
  • must read  There is no easy fix for Facebook’s reliability problem.  Frédéric Filloux in Monday Note
  • must read  Washington Post Executive Editor Martin Baron delivers Reuters Memorial Lecture at the University of Oxford.  Washington Post [thankfully, at the moment, this doe not seem to behind the Post’s pay wall]

Radio/Podcasting/Digital Audio

Weekend readings for #pubmedia, Feb. 24, 2018

Here’s another collection (a bit slimmer than usual for some reason) of selected links from my @haarsager Twitter feed.  --Dennis

ATSC 3.0/HbbTV

  • HPA panel examines road to ATSC 3.0 and repack.  TVTechnology

Cable/Satellite/MVPD/Cord-Cutting

  • How did satellite TV go from a $50B business to ‘less than zero’ in three short years?  FierceCable  …and…  Dish loses 200K more linear TV subscribers in Q4; value of satellite business ‘less than zero,’ analyst postulates.  FierceCable

Digital Video/OTT/VOD

  • Buoyant SVOD boosts U.S. TV market to be worth $140B by end of 2018.  Rapid TV News
  • TV Everywhere use encouraging SVOD adoption?  nScreenMedia

Journalism

Radio/Podcasting/Digital Audio

Getting started with stringr for textual analysis in R

Manipulating characters – a.k.a. non-numerical data – is an essential skill for anyone looking to visualize or analyze text data. This tutorial will go over a few of the base R functions for manipulating strings in R, and introduce the stringr package from the tidyverse. The datasets being used are being analyzed as part of the Reinventing Local TV News Project at Northeastern University’s School of Journalism.  The full RMarkdown file can be found here.

Load the Packages

Start by loading the packages we will be using in this tutorial.

library(dplyr) # Data wrangling, glimpse(75) and tbl_df().

library(ggplot2) # Visualise data.
library(lubridate) # Dates and time.
library(readr) # Efficient reading of CSV data.
library(stringr) # String operations.
library(tibble) # Convert row names into a column.
library(tidyr) # Prepare a tidy dataset, gather().
library(magrittr) # Pipes %>%, %T>% and equals(), extract().
library(tidyverse) # all tidyverse packages
library(mosaic) # favstats and other summary functions
library(fs) # file management functions
library(forcats) # manipulate data for visualization
library(cowplot) # visualization
library(stringi) # more strings
library(tidytext) # tidying text data for analysis
library(maps) # maps for us.cities

Load the Data

We will be using 6 months of news article data from ABC7NY in New York and KCRA in California, spanning July 18 to January 16 (headline, date-time, teaser, url). All times are Eastern Standard Time. You can find the files here: abc7ny.csv and kcra.csv.

Abc7 <- read_csv("Data/abc7ny.csv")
Kcra <- read_csv("Data/kcra.csv")

Inspect the data sets

Take a quick look at each data set with dplyr::glimpse(75)

Abc7 %>% glimpse(78)
Observations: 9,745
Variables: 6
$ datetime  <chr> "July 18, 2017 at 03:41PM", "July 18, 2017 at 03:55PM",...
$ headline  <chr> "9-year-old boy wants to thank every cop in the U.S. wi...
$ url       <chr> "http://abc7ny.com/news/donut-boy-wants-to-thank-every-...
$ teaser    <chr> "Tyler Carach, a 9-year-old boy from Florida, wants to ...
$ feed_name <chr> "abc7ny.com RSS Feed", "abc7ny.com RSS Feed", "abc7ny.c...
$ feed_url  <chr> "http://abc7ny.com/feed", "http://abc7ny.com/feed", "ht...
Kcra %>% glimpse(78)
Observations: 13,020
Variables: 6
$ datetime  <chr> "July 18, 2017 at 03:56PM", "July 18, 2017 at 03:58PM",...
$ headline  <chr> "Woman says product intended for wasps trapped 7 birds ...
$ url       <chr> "http://www.kcra.com/article/woman-says-product-intende...
$ teaser    <chr> "The customer's Facebook post has been shared thousands...
$ feed_name <chr> "KCRA Top Stories", "KCRA Top Stories", "KCRA Top Stori...
$ feed_url  <chr> "http://www.kcra.com", "http://www.kcra.com", "http://w...

We can see these data frames contain the same variables, but if we had many, many columns we could use base::identical()and base::names() to test if the columns are the same.

base::identical(names(Abc7), names(Kcra))
[1] TRUE

Combine the data sets

We want to combine these data sets into a single data frame NewsData. As with most operations in R, there are multiple ways to approach combining data frames. I prefer to use dplyr for merging and joining because 1) the functions are fast and efficient and 2) the arguments are somewhat intuitive.

I say somewhat because dplyr::bind_rows() sticks two data frames together top-to-bottom, and dplyr::bind_cols() puts two data frames together side-by-side. If you look at the figure below, you can see what I mean. Combining two data frames together top-to-bottom means the data gets added into the matched columns (and un-matched columns get filled with NA).

But if I want to combine data frames together side-by-side, they will be matched on their row position (so I would need to make sure the same number of rows are in each data frame).

NOTE: The tiny object in the rows are chairs, because for some reason, whenever I think of rows, I think of a row of chairs. The same goes for columns (except I think about a Roman pillar).

Which one do I want to use?

I can see from the code chunks above that both data frames have identical column names, but an unequal number of rows. This makes dplyr::bind_rows() the correct option. I might want to separate each data frame again later, so including an ID (like data_id) that allows me to see what data set each headline originally came from is a good idea. Fortunately, there is an argument in dplyr::bind_rows() for including an id (.id =).

Before I start executing functions, I should think about to expect in NewsData. The Abc7 data frame has 9,745 and 6 variables, and Kcra has 13,020 observations and 6 variables. If I use dplyr::bind_rows(), I’m expecting a data frame with the sum of all observations (i.e. 22,765) and 6 variables.

# test 
dplyr::bind_rows(Abc7, Kcra, .id = "data_id") %>% 
    dplyr::count(data_id)
data_id
<chr>
n
<int>
1 9745
2 13020

NOTE: I’m going to introduce a little sequence I go through for most data manipulation tasks. It includes three steps: 1) test, 2) assign, and 3) verify. These steps are for making sure I am getting what I expect from each task. In the test step, I set up some way of verifying the function or pipeline is doing what I want. For this example, I used dplyr::count() to see if "data_id" is the new data frame and if it can distinguish the original data sets.

Now I will assign the new variables to NewsData and verify it gives the same information.

# assign
NewsData <- dplyr::bind_rows(Abc7, Kcra, .id = "data_id")
# verify
NewsData %>% 
    dplyr::count(data_id)
data_id
<chr>
n
<int>
1 9745
2 13020

Great! I just need to remember that 1 is the id for Abc7 and 2 is the id for Kcra. Now I can start with the string manipulations.

NewsData %>% 
    glimpse(75)
Observations: 22,765
Variables: 7
$ data_id   <chr> "1", "1", "1", "1", "1", "1", "1", "1", "1", "1", "1...
$ datetime  <chr> "July 18, 2017 at 03:41PM", "July 18, 2017 at 03:55P...
$ headline  <chr> "9-year-old boy wants to thank every cop in the U.S....
$ url       <chr> "http://abc7ny.com/news/donut-boy-wants-to-thank-eve...
$ teaser    <chr> "Tyler Carach, a 9-year-old boy from Florida, wants ...
$ feed_name <chr> "abc7ny.com RSS Feed", "abc7ny.com RSS Feed", "abc7n...
$ feed_url  <chr> "http://abc7ny.com/feed", "http://abc7ny.com/feed", ...

String manipulation with base R

There are a few functions in base R that come in handy when dealing with strings. These first functions we will cover are basic, but they introduce important concepts like how strings are printed, and the kinds of manipulations that are possible with R. I’ll demo these by taking the first five lines of the headline column and putting it into it’s object (headlines_var) using dplyr::select() and Matrix::head().

headlines_var <- NewsData %>% 
    dplyr::select(headline) %>% 
    Matrix::head(5) 

Testing Character Strings

The base functions in R takes a character vector, so the first thing I’ll need to do is test and see if headlines_var satisfies that condition. I can do this with base::is.character().

base::is.character(headlines_var)
[1] FALSE

FALSE!?!? But this looked like a character vector when I used dplyr::glimpse(75) above. What kind of object this isheadlines_var?

I can test that with base::typeof().

base::typeof(headlines_var)
[1] "list"

Ahhhh headlines_var is a list. This means I’ll need to use base::unlist() to convert the headlines_var list to a character vector.

headlines_var <- headlines_var %>% base::unlist() 
base::is.character(headlines_var)
[1] TRUE

NOTE: Other options for converting objects to strings include base::is.character() and base::toString().

I’ll take a look at this vector and see what the contents look like with utils::str().

headlines_var %>% utils::str()
 Named chr [1:5] "9-year-old boy wants to thank every cop in the U.S. with doughnuts" ...
 - attr(*, "names")= chr [1:5] "headline1" "headline2" "headline3" "headline4" ...

We can see the unlist() function retains the "names" attribute in the headlines_var vector.

headlines_var
                                                                     headline1 
          "9-year-old boy wants to thank every cop in the U.S. with doughnuts" 
                                                                     headline2 
"10-year-old boy critical after being struck by boat propeller on Long Island" 
                                                                     headline3 
                 "10-year-old boy critical after Long Island boating accident" 
                                                                     headline4 
      "American Airlines mechanic marks record-breaking 75 years with company" 
                                                                     headline5 
                        "12-year-old girl pulled from surf in Sandy Hook dies" 

Removing characters

I can see from the contents of headlines_var that it is a vector with all five headlines. I’ll demonstrate the base::sub()function by removing the - characters.

base::sub(pattern = "-", replacement = " ", x = headlines_var)
                                                                     headline1 
          "9 year-old boy wants to thank every cop in the U.S. with doughnuts" 
                                                                     headline2 
"10 year-old boy critical after being struck by boat propeller on Long Island" 
                                                                     headline3 
                 "10 year-old boy critical after Long Island boating accident" 
                                                                     headline4 
      "American Airlines mechanic marks record breaking 75 years with company" 
                                                                     headline5 
                        "12 year-old girl pulled from surf in Sandy Hook dies" 

The first pass with base::sub() only finds the first instance of - and replaces it with a blank space " ". If I want to remove ALL instances of -, I can use base::gsub().

base::gsub(pattern = "-", replacement = " ", x = headlines_var)
                                                                     headline1 
          "9 year old boy wants to thank every cop in the U.S. with doughnuts" 
                                                                     headline2 
"10 year old boy critical after being struck by boat propeller on Long Island" 
                                                                     headline3 
                 "10 year old boy critical after Long Island boating accident" 
                                                                     headline4 
      "American Airlines mechanic marks record breaking 75 years with company" 
                                                                     headline5 
                        "12 year old girl pulled from surf in Sandy Hook dies" 

Another option for replacing every instance of a character is base::chartr(), but this requires that the old argument is the same length of the new argument (otherwise you will see 'old' is longer than 'new').

base::chartr(old = "-", new = " ", x = headlines_var)
                                                                     headline1 
          "9 year old boy wants to thank every cop in the U.S. with doughnuts" 
                                                                     headline2 
"10 year old boy critical after being struck by boat propeller on Long Island" 
                                                                     headline3 
                 "10 year old boy critical after Long Island boating accident" 
                                                                     headline4 
      "American Airlines mechanic marks record breaking 75 years with company" 
                                                                     headline5 
                        "12 year old girl pulled from surf in Sandy Hook dies" 

Pasting

Whenever you need to combine or “stick” string elements together, you can either use base::paste() or base::paste0(). For example, if I wanted to combine all of these headlines into a single, long, character vector, I could use the following

base::paste(headlines_var, collapse = "; ")
[1] "9-year-old boy wants to thank every cop in the U.S. with doughnuts; 10-year-old boy critical after being struck by boat propeller on Long Island; 10-year-old boy critical after Long Island boating accident; American Airlines mechanic marks record-breaking 75 years with company; 12-year-old girl pulled from surf in Sandy Hook dies"

Or if I wanted to combine all the headlines but not include any whitespace between the characters, I could use base::paste0()

base::paste0(headlines_var, sep = "", collapse = "; ")
[1] "9-year-old boy wants to thank every cop in the U.S. with doughnuts; 10-year-old boy critical after being struck by boat propeller on Long Island; 10-year-old boy critical after Long Island boating accident; American Airlines mechanic marks record-breaking 75 years with company; 12-year-old girl pulled from surf in Sandy Hook dies"

Printing

I typically use RStudio Notebooks, so I like to have some flexibility with my printing options. There are a few base R printing options you should know for printing strings (or anything) to the R console.

If you want to see the results of a vector printed without quotes, use base::noquote()

base::noquote(headlines_var)
                                                                   headline1 
          9-year-old boy wants to thank every cop in the U.S. with doughnuts 
                                                                   headline2 
10-year-old boy critical after being struck by boat propeller on Long Island 
                                                                   headline3 
                 10-year-old boy critical after Long Island boating accident 
                                                                   headline4 
      American Airlines mechanic marks record-breaking 75 years with company 
                                                                   headline5 
                        12-year-old girl pulled from surf in Sandy Hook dies 

Another option is base::cat(). This also comes with a sep = argument.

base::cat(headlines_var, sep = ", ")
9-year-old boy wants to thank every cop in the U.S. with doughnuts, 10-year-old boy critical after being struck by boat propeller on Long Island, 10-year-old boy critical after Long Island boating accident, American Airlines mechanic marks record-breaking 75 years with company, 12-year-old girl pulled from surf in Sandy Hook dies

The stringr package

The tidyverse comes with stringr, a handy package for handling string manipulations. You can find it on the tidyversewebsite or you can read about here in R for Data Science.

stringr (like other packages in the tidyverse) is very convenient because all of the functions have a common prefix, str_

p

Everything we just did with base R is possible with stringr, so I’m going to go through some of this package’s lesser-known functions.

Changing case

It’s often useful to convert the entire corpus of text to lowercase so future string matching is a little easier. I can do this by changing the case of headlines and storing it in a new variable headline_low using stringr::str_to_lower() and dplyr::mutate().

NOTE: I’m going to perform the remaining functions with the NewsData data frame (because that is the preferred object in the tidyverse).

NewsData %>% 
    dplyr::mutate(headline_low = stringr::str_to_lower(headline)) %>% 
    dplyr::select(headline, headline_low) %>% 
    head(5)
headline
<chr>
9-year-old boy wants to thank every cop in the U.S. with doughnuts
10-year-old boy critical after being struck by boat propeller on Long Island
10-year-old boy critical after Long Island boating accident
American Airlines mechanic marks record-breaking 75 years with company
12-year-old girl pulled from surf in Sandy Hook dies

Then again, these are headlines, so maybe we want another variable that converts all headlines to Title Case using stringr::str_to_title().

NewsData %>% 
    dplyr::mutate(headline_title = stringr::str_to_title(headline)) %>% 
    dplyr::select(headline, headline_title) %>% 
    head(5)
headline
<chr>
9-year-old boy wants to thank every cop in the U.S. with doughnuts
10-year-old boy critical after being struck by boat propeller on Long Island
10-year-old boy critical after Long Island boating accident
American Airlines mechanic marks record-breaking 75 years with company
12-year-old girl pulled from surf in Sandy Hook dies

Finding words

I might also curious about the first few words in the teaser associated with each headline. Let’s assume I want to see the frequency of each word by news feed (or data_id). I can use the stringr::word() function to extract the first three words and store it in a new variable teaser_3_words.

# test
NewsData %>% 
    dplyr::mutate(teaser_3_words = stringr::word(NewsData$teaser, 1, 3)) %>% 
    count(teaser_3_words, sort = TRUE) %>% 
    head(10)
teaser_3_words
<chr>
n
<int>
President Donald Trump 216
Get weather conditions 132
Police say the 114
KCRA 3 Weather 107
Here and Now: 102
Good morning, Northern 87
The incident happened 77
The fire broke 65
Authorities say the 43
The New York 42

This looks like it’s working, so I’ll assign teaser_3_words to the NewsData data frame.

NewsData <- NewsData %>% 
    dplyr::mutate(teaser_3_words = stringr::word(NewsData$teaser, 1, 3))

Now I can verify this new variable is behaving the way it should by using the same dplyr::count() function above.

NewsData %>% 
    dplyr::count(teaser_3_words, sort = TRUE) %>% 
    utils::head(10)
teaser_3_words
<chr>
n
<int>
President Donald Trump 216
Get weather conditions 132
Police say the 114
KCRA 3 Weather 107
Here and Now: 102
Good morning, Northern 87
The incident happened 77
The fire broke 65
Authorities say the 43
The New York 42

Sometimes I like to verify a new variable using a visualization instead of a table. I find it helpful to think of the data I am manipulating as a distribution (or shape) instead of just a set of numbers in a table. A figure has more attributes I can think about (shape, size, color, position, etc.), where a table just has lines and text.

For example, when I created teaser_3_words with the first three words from the teaser, I was thinking about how those words might vary by station (ABC7NY or KCRA) over time. I assume there is some overlap in teaser_3_words between these stations. I can see this if I run dplyr::distinct() and base::nrow().

NewsData %>% 
    dplyr::distinct(teaser_3_words) %>% 
    base::nrow()
[1] 15415

If there are 15415 distinct teaser_3_words and 22765 observations in NewsData, I can safely assume there is some overlap between these two stations.

Create a visualization with a pipeline

If I want to visualize this, I need to add a column to the NewsData data frame that has the results from dplyr::count(). This is possible with dplyr::add_count(). Then I want to dplyr::arrange() the data so the largest numbers are on top. n isn’t a very descriptive variable name, so I will dplyr::rename() this to tease_3rd_count.

Things get a little trickier here, because I also want to add a total N by news feed and a proportion variable that will tell me how many times teaser_3_words showed up in that teaser relative to the total number of teasers in the feed (tease_3rd_prop).

This little trick can be accomplished using the following steps:

  1. Use dplyr::group_by(), dplyr::add_tally(), and dplyr::ungroup() to collapse the data frame on the two news feeds in data_id, create a summary n variable, and then expand this data frame back to it’s original shape (plus one variable).
  2. Change the name of n to newsfeed_n with dplyr::rename()
  3. Finally, use dplyr::mutate() to create the proportion variable tease_3rd_prop, a factor version of data_id, and convert the existing teaser_3_words variable to a factor.

When I test a long pipeline like this, I do it iteratively. At the end of each step, I add a %>% dplyr::glimpse(75) or another viewing function to see what I am getting.

NewsData <- NewsData %>% 
    dplyr::add_count(teaser_3_words) %>% # count this variable and add it
    dplyr::arrange(desc(n)) %>% # arrange the new n data with largest on top
    dplyr::rename(tease_3rd_count = n) %>%  # get rid of n variable
    dplyr::group_by(data_id) %>% # collapse the data frame by news feed
    dplyr::add_tally() %>% # add the total count 
    dplyr::ungroup() %>% # expand the data to all variables again
    dplyr::rename(newsfeed_n = n) %>% # rename n to newsfeed_n
    dplyr::mutate(tease_3rd_prop = tease_3rd_count/newsfeed_n, # create prop
            data_id_fct = factor(data_id, # create factor for ID
                                   levels = c(1, 2),
                                   labels = c("Abc7", 
                                          "Kcra")),
            teaser_3_words = factor(teaser_3_words)) 
NewsData %>% 
    dplyr::glimpse(75)
Observations: 22,765
Variables: 12
$ data_id         <chr> "1", "1", "1", "1", "1", "1", "1", "1", "1", "...
$ datetime        <chr> "July 18, 2017 at 05:39PM", "July 19, 2017 at ...
$ headline        <chr> "President Trump blasts Congress over failure ...
$ url             <chr> "http://abc7ny.com/politics/trump-blasts-congr...
$ teaser          <chr> "President Donald Trump blasted congressional ...
$ feed_name       <chr> "abc7ny.com RSS Feed", "abc7ny.com RSS Feed", ...
$ feed_url        <chr> "http://abc7ny.com/feed", "http://abc7ny.com/f...
$ teaser_3_words  <fct> President Donald Trump, President Donald Trump...
$ tease_3rd_count <int> 216, 216, 216, 216, 216, 216, 216, 216, 216, 2...
$ newsfeed_n      <int> 9745, 9745, 9745, 9745, 9745, 9745, 9745, 9745...
$ tease_3rd_prop  <dbl> 0.02217, 0.02217, 0.02217, 0.02217, 0.02217, 0...
$ data_id_fct     <fct> Abc7, Abc7, Abc7, Abc7, Abc7, Abc7, Abc7, Abc7...

Now I can create a Cleveland Plot that shows the proportion of the first three word occurrence by news station. Note that I also use a few dplyr functions to make the plot a little clearer.

NewsData %>% 
    dplyr::arrange(desc(tease_3rd_prop)) %>% # sort desc by the proportion
    dplyr::filter(tease_3rd_count >= 50) %>% # only keep frequecies above 50
    dplyr::filter(!is.na(teaser_3_words)) %>% # remove missing
    # Make the plot
    ggplot2::ggplot(aes(x = tease_3rd_prop, # plot the prop
                        y = fct_reorder(teaser_3_words, # reorder words
                                        tease_3rd_count), # by counts
                     fill = data_id_fct,
                    group = teaser_3_words)) + # fill by feed
    ggplot2::geom_segment(aes(yend = teaser_3_words), 
                     xend = 0, 
                    color = "grey50") +
    ggplot2::geom_point(size = 3, 
                   aes(color = data_id_fct), 
                 show.legend = FALSE) + 
    ggplot2::facet_wrap( ~ data_id_fct, # arrange in 2 columns
           nrow = 2, 
         scales = "free", # free scales
       labeller = as_labeller( # add custom lables
       c(`Abc7` = "ABC7NY News Feed", 
         `Kcra` = "KCRA Sacramento News Feed"))) +
            ggplot2::scale_x_continuous(labels = scales::percent) + # use %
            ggplot2::theme(strip.text.x = element_text(face = "bold")) + # bold type
            ggplot2::labs( # labels and captions
                  x = "Percent First Three Words Appeared", 
                  y = NULL,
            caption = "These are the first three words from headline teasers 
            appearing in ABC7NY and KCRA (from Sacramento)",
              title = "TEAS3RS - Trump, Weather, Police",
           subtitle = "The First Three Words From News Headlines Teasers") 


As you can see, these pipelines provide a lot of flexibility for manipulating and visualizing data.

Joins

When you want to combine data frame one data set into another, but match these data on a common variable, you need to perform a join. Broadly speaking, there are two types of joins: inner and outer.

Inner joins

Inner joining comes in handy when you need to combine two tables, but only want keep the observations that are present in both tables. Read more about these here.

Outer joins

Outer joins can come in three types: left, right , and full outer joins. The left_join() gets all the rows from the left table, including those with NA values in the join field.

The important thing about dplyr::left_join() is the order the tables are listed in the function. Inside the dplyr::left_join()function, the first table listed is the primary table, and the second table is the secondary table. The dplyr::left_join() will join the secondary table to the primary table by matching on the rows from the primary table, even if there aren’t matches with rows in the secondary table.

I’ll demonstrate a join using the data from the maps package.

Joining to maps data

UsCity <- maps::us.cities
UsCity %>% glimpse(75)
Observations: 1,005
Variables: 6
$ name        <chr> "Abilene TX", "Akron OH", "Alameda CA", "Albany GA...
$ country.etc <chr> "TX", "OH", "CA", "GA", "NY", "OR", "NM", "LA", "V...
$ pop         <int> 113888, 206634, 70069, 75510, 93576, 45535, 494962...
$ lat         <dbl> 32.45, 41.08, 37.77, 31.58, 42.67, 44.62, 35.12, 3...
$ long        <dbl> -99.74, -81.52, -122.26, -84.18, -73.80, -123.09, ...
$ capital     <int> 0, 0, 0, 0, 2, 0, 0, 0, 0, 0, 0, 0, 0, 0, 0, 0, 0,...

I want to join the name of the city in NewsData to the city in maps::us.cities (now UsCity). First I want to know how many city names are in UsCity.

UsCity %>% dplyr::distinct(name) %>% base::nrow()
[1] 1005

There are 1005 distinct cities in this data frame. The city information I want to use from NewsData is stored in the headline. In order to join these data frames, they need to joined on an ID that is the same case and string in each data frame. In order to do this, I need to talk a little about regular expressions.

Regular Expressions (regex)

Regular expressions are “pattern[s] which specifies a set of strings of characters”. They are used for pattern matching in many programming languages. If you’re going to be analyzing mostly textual data, I recommend the excellent texts from O’Reilly and the introduction from Thomas Nield.

An example of a regular expression to extract all the numerical characters in headlines_var would be:

stringr::str_extract_all(string = headlines_var, pattern = "[\\d]")
[[1]]
[1] "9"

[[2]]
[1] "1" "0"

[[3]]
[1] "1" "0"

[[4]]
[1] "7" "5"

[[5]]
[1] "1" "2"

If this looks strange to you, it’s because regular expressions are a bit of a nightmare. They were originally created in the 1940s as a way to describe languages, but now their primary purpose is to test the frustration threshold for programmers and analysts.

Why are regular expressions so awful/powerful?

Regular expressions are highly composable, which only adds to their complexity. The composability of a system or language refers to how many ways we can mix and match it’s elements together to satisfy our needs (which in this case means to ‘match a string or character’). For any given string or set of strings, there are countless ways of matching it with regular expressions.

“The composability of the language is the degree to which the various methods of composition can be applied uniformly to all the various objects of the language, both atomic and compound.” – James Clark

Regular Expressions in R

R has some funny quirks that add the fun of using regular expressions. In real life (outside of R), we would’ve used the following abstract sequence to match any digit from 0 to 9 in headlines_var.

stringr::str_extract_all(string = headlines_var, pattern = "[\d]")
# Error: '\d' is an unrecognized escape in character string starting ""[\d"

But in R we have to “escape the escape” character \, which means "[\d]" becomes "[\\d]". This is important if you are using a regular expression testing website. These websites allow you check a regular expression on some sample text, but they might match your needs within R.


Common Regular Expressions

Below is a quick list of regular expressions I use often:

Symbol = What it does

$ = Matches the end of the line

^ = Matches the beginning of the line

+ = Matches one or more of the specified characters

* = Matches 0 or more of the specified characters

\\w = Matches any word character (0-9, A-z). To match non-word characters, use \\W

\\s = Matches any whitespace character (tab, line feed, or carriage return). To match non-whitespace characters, use \\S

\\t = Matches a tab character

\\r = Matches a carriage return. Use \\n for line feed.

\\ = This is the escape character. It matches the exact character that follows, not the regex pattern character.

Create city_id in UsCity

Remove the state from the name variable using the information stored in country.etc. I can do this by putting using the state information in country.etc and stringr::str_replace_all() to create city. I will also trim any additional whitespace from this variable with stringr::str_trim() and convert it to lower case using stringr::str_to_lower().

UsCity <- UsCity %>% 
    mutate(city_id = stringr::str_replace_all(string = UsCity$name, 
                         pattern = UsCity$country.etc, 
                         replacement = ""),
           city_id = stringr::str_trim(city_id),
           city_id = stringr::str_to_lower(city_id))
UsCity %>% glimpse(75)
Observations: 1,005
Variables: 7
$ name        <chr> "Abilene TX", "Akron OH", "Alameda CA", "Albany GA...
$ country.etc <chr> "TX", "OH", "CA", "GA", "NY", "OR", "NM", "LA", "V...
$ pop         <int> 113888, 206634, 70069, 75510, 93576, 45535, 494962...
$ lat         <dbl> 32.45, 41.08, 37.77, 31.58, 42.67, 44.62, 35.12, 3...
$ long        <dbl> -99.74, -81.52, -122.26, -84.18, -73.80, -123.09, ...
$ capital     <int> 0, 0, 0, 0, 2, 0, 0, 0, 0, 0, 0, 0, 0, 0, 0, 0, 0,...
$ city_id     <chr> "abilene", "akron", "alameda", "albany", "albany",...

I will need to check all the words in the headline to see how many mention the cities in city_id. To do this I need to put the UsCity$city_id into it’s own vector city_id_vec. I can do this with base::unlist() and base::paste(). I should consider how I’ll be searching for a pattern match, though. Take the example headline below:

"Trump to attend commissioning of USS Gerald R. Ford warship"

If I don’t include spaces around the collapse = " | " argument I would get a match for the city mission (for Mission, TX).

city_id_vec <- unlist(UsCity$city_id)
city_id_vec <- paste(city_id_vec, sep = "", collapse = " | ")

This new vector should look like this:

[1] "abilene | akron | alameda | albany | albany | albany | albuquerque | 
alexandria | alexandria | alhambra | aliso viejo | allen | allentown | aloha
| altadena | altamonte springs | altoona | amarillo | ames | anaheim | 
anchorage | anderson | andover | ann arbor | annandale | annapolis | antioch
| apple valley | apple valley | appleton | arcadia | arden-arcade | 
arlington heights | arlington | arlington | arlington | arvada |...

Create city_id in NewsData

Now I need to make sure the contents of headline in NewsData are all lower case.

NewsData <- NewsData %>% 
    mutate(headline = stringr::str_to_lower(headline))
NewsData %$% head(headline, 1)
[1] "president trump blasts congress over failure of gop health care bill"

The trick here is to see which headlines in NewsData contains cities from city_id. I do this by dropping stringr::str_detect() inside dplyr::filter() to only include the data with a match from city_id. The stringr::str_detect() function takes string vector (or character column) as an input and check for matches provided by the pattern argument.

MapNewsData <- NewsData %>% 
    filter(stringr::str_detect(string = headline, 
                               pattern = city_id_vec)) %>% 
    dplyr::select(headline, 
            dplyr::everything())
MapNewsData %>% dplyr::glimpse(75)
Observations: 2,322
Variables: 12
$ headline        <chr> "president trump, politicians take to twitter ...
$ data_id         <chr> "1", "1", "1", "1", "1", "2", "2", "1", "1", "...
$ datetime        <chr> "October 31, 2017 at 06:49PM", "November 27, 2...
$ url             <chr> "http://abc7ny.com/trump-tweets-after-nyc-ramp...
$ teaser          <chr> "President Donald Trump called the deadly truc...
$ feed_name       <chr> "abc7ny.com RSS Feed", "abc7ny.com RSS Feed", ...
$ feed_url        <chr> "http://abc7ny.com/feed", "http://abc7ny.com/f...
$ teaser_3_words  <fct> President Donald Trump, President Donald Trump...
$ tease_3rd_count <int> 216, 216, 216, 216, 216, 216, 216, 114, 114, 1...
$ newsfeed_n      <int> 9745, 9745, 9745, 9745, 9745, 13020, 13020, 97...
$ tease_3rd_prop  <dbl> 0.022165, 0.022165, 0.022165, 0.022165, 0.0221...
$ data_id_fct     <fct> Abc7, Abc7, Abc7, Abc7, Abc7, Kcra, Kcra, Abc7...

Now that I’ve filtered the data set down to only those 2,322 I’ll be needing to join back to UsCity, I need to create a city_idvariable in MapNewsData. I can do this with stringr::str_extract(). This function takes a string vector, a pattern to match on (which I create with paste(city_id_vec, collapse = "|")).

MapNewsData <- MapNewsData %>% 
    mutate(city_id = str_extract(string = MapNewsData$headline, 
                     pattern = paste(city_id_vec, collapse = "|")),
           city_id = stringr::str_trim(city_id)) 
MapNewsData %>% 
    count(city_id, sort = TRUE) %>% 
    head(5)
city_id
<chr>
n
<int>
sacramento 384
new york 318
las vegas 178
stockton 76
sandy 68

This looks like it’s working. I am going to use dplyr::inner_join() to combine MapNewsData and UsCity by city_id. The result should only be observations with data in both tables (hopefully cities in both tables). I can check this with a combination of dplyr::count() and tidyr::spread().

dplyr::inner_join(MapNewsData, UsCity, by = "city_id") %>% 
    utils::head(20) %>% 
    dplyr::count(city_id, name) %>% 
    tidyr::spread(name, n)
city_id
<chr>
Bayonne NJ
<int>
Manhattan KS
<int>
Moore OK
<int>
New York NY
<int>
Newark CA
<int>
Newark NJ
<int>
Newark OH
<int>
Reno NV
<int>
bayonne 1 NA NA NA NA NA NA NA
manhattan NA 3 NA NA NA NA NA NA
moore NA NA 5 NA NA NA NA NA
new york NA NA NA 1 NA NA NA NA
newark NA NA NA NA 3 3 3 NA
reno NA NA NA NA NA NA NA 1

I can see one potential problem here: moore in MapNewsData could refer to a person (like Senator Moore) and not a city (like Moore OK). The best way to distinguish between cases like this is to know your data. Computers can’t replace brains when it comes to content knowledge (yet).

I am going to go ahead and join these data frames together and clean the dates.

MapNewsData <- dplyr::inner_join(MapNewsData, UsCity, by = "city_id")

separate, str_sub, and make_datetime

The dates (datetime) variable is not in a format I can use. I want to get the date components into a YYYY-MM-DD format. I’ll start this process with tidyr::separate()

# test
tidyr::separate(MapNewsData, 
         datetime, 
         into = c("month", "day", "year", "at", "hour", "min")) %>% 
    dplyr::select(headline,
                  month:min,
                  dplyr::everything()) %>% 
    dplyr::glimpse(75)
Observations: 2,603
Variables: 24
$ headline        <chr> "president trump, politicians take to twitter ...
$ month           <chr> "October", "November", "November", "December",...
$ day             <chr> "31", "27", "27", "10", "10", "23", "10", "19"...
$ year            <chr> "2017", "2017", "2017", "2017", "2017", "2017"...
$ at              <chr> "at", "at", "at", "at", "at", "at", "at", "at"...
$ hour            <chr> "06", "08", "08", "08", "10", "09", "05", "10"...
$ min             <chr> "49PM", "51AM", "55AM", "56AM", "56AM", "06PM"...
$ data_id         <chr> "1", "1", "1", "1", "1", "2", "2", "1", "1", "...
$ url             <chr> "http://abc7ny.com/trump-tweets-after-nyc-ramp...
$ teaser          <chr> "President Donald Trump called the deadly truc...
$ feed_name       <chr> "abc7ny.com RSS Feed", "abc7ny.com RSS Feed", ...
$ feed_url        <chr> "http://abc7ny.com/feed", "http://abc7ny.com/f...
$ teaser_3_words  <fct> President Donald Trump, President Donald Trump...
$ tease_3rd_count <int> 216, 216, 216, 216, 216, 216, 216, 114, 114, 1...
$ newsfeed_n      <int> 9745, 9745, 9745, 9745, 9745, 13020, 13020, 97...
$ tease_3rd_prop  <dbl> 0.02217, 0.02217, 0.02217, 0.02217, 0.02217, 0...
$ data_id_fct     <fct> Abc7, Abc7, Abc7, Abc7, Abc7, Kcra, Kcra, Abc7...
$ city_id         <chr> "new york", "moore", "moore", "moore", "moore"...
$ name            <chr> "New York NY", "Moore OK", "Moore OK", "Moore ...
$ country.etc     <chr> "NY", "OK", "OK", "OK", "OK", "NV", "OK", "KS"...
$ pop             <int> 8124427, 48749, 48749, 48749, 48749, 206626, 4...
$ lat             <dbl> 40.67, 35.33, 35.33, 35.33, 35.33, 39.54, 35.3...
$ long            <dbl> -73.94, -97.47, -97.47, -97.47, -97.47, -119.8...
$ capital         <int> 0, 0, 0, 0, 0, 0, 0, 0, 0, 0, 0, 0, 0, 0, 0, 0...

Ok now that I’ve separated the components, I need to convert them all into formats I can use. Follow the comments in the pipeline below to see how these work.

    tidyr::separate(MapNewsData, 
         datetime, 
          into = c("month", 
                  "day", 
                  "year", 
                  "at", 
                  "hour", 
                  "min")) %>% # I know this works
    dplyr::mutate( # new variables
         month = match(month, month.name), # month.name is loaded with R
           day = as.numeric(day), # make numeric day
          year = as.numeric(year), # # make numeric year
      am_or_pm = stringr::str_sub(min, 
                           start = 3, 
                             end = 4),  # break up min from AM/PM
          hour = if_else(am_or_pm %in% "PM", # condition for 24H time
                 as.numeric(hour) + 12, # 24 hour
                 as.numeric(hour)),
        minute = stringr::str_sub(min, 
                         start = 1, # get the minute elemets
                           end = 2),
           min = as.numeric(minute), # format the minutes
          date = lubridate::make_date(
                   year = year,
                  month = month,
                    day = day), 
      datetime = lubridate::make_datetime( # create the datetime
                   year = year, 
                  month = month, 
                    day = day, 
                   hour = hour, 
                    min = min)) %>% 
    dplyr::glimpse(75)
Observations: 2,603
Variables: 28
$ headline        <chr> "president trump, politicians take to twitter ...
$ data_id         <chr> "1", "1", "1", "1", "1", "2", "2", "1", "1", "...
$ month           <int> 10, 11, 11, 12, 12, 8, 11, 7, 7, 7, 7, 7, 7, 7...
$ day             <dbl> 31, 27, 27, 10, 10, 23, 10, 19, 21, 30, 30, 30...
$ year            <dbl> 2017, 2017, 2017, 2017, 2017, 2017, 2017, 2017...
$ at              <chr> "at", "at", "at", "at", "at", "at", "at", "at"...
$ hour            <dbl> 18, 8, 8, 8, 10, 21, 5, 22, 23, 8, 8, 8, 8, 8,...
$ min             <dbl> 49, 51, 55, 56, 56, 6, 24, 42, 7, 8, 8, 8, 15,...
$ url             <chr> "http://abc7ny.com/trump-tweets-after-nyc-ramp...
$ teaser          <chr> "President Donald Trump called the deadly truc...
$ feed_name       <chr> "abc7ny.com RSS Feed", "abc7ny.com RSS Feed", ...
$ feed_url        <chr> "http://abc7ny.com/feed", "http://abc7ny.com/f...
$ teaser_3_words  <fct> President Donald Trump, President Donald Trump...
$ tease_3rd_count <int> 216, 216, 216, 216, 216, 216, 216, 114, 114, 1...
$ newsfeed_n      <int> 9745, 9745, 9745, 9745, 9745, 13020, 13020, 97...
$ tease_3rd_prop  <dbl> 0.02217, 0.02217, 0.02217, 0.02217, 0.02217, 0...
$ data_id_fct     <fct> Abc7, Abc7, Abc7, Abc7, Abc7, Kcra, Kcra, Abc7...
$ city_id         <chr> "new york", "moore", "moore", "moore", "moore"...
$ name            <chr> "New York NY", "Moore OK", "Moore OK", "Moore ...
$ country.etc     <chr> "NY", "OK", "OK", "OK", "OK", "NV", "OK", "KS"...
$ pop             <int> 8124427, 48749, 48749, 48749, 48749, 206626, 4...
$ lat             <dbl> 40.67, 35.33, 35.33, 35.33, 35.33, 39.54, 35.3...
$ long            <dbl> -73.94, -97.47, -97.47, -97.47, -97.47, -119.8...
$ capital         <int> 0, 0, 0, 0, 0, 0, 0, 0, 0, 0, 0, 0, 0, 0, 0, 0...
$ am_or_pm        <chr> "PM", "AM", "AM", "AM", "AM", "PM", "AM", "PM"...
$ minute          <chr> "49", "51", "55", "56", "56", "06", "24", "42"...
$ date            <date> 2017-10-31, 2017-11-27, 2017-11-27, 2017-12-1...
$ datetime        <dttm> 2017-10-31 18:49:00, 2017-11-27 08:51:00, 201...

Now I will assign these new variables to MapNewsData and visualize the occurrence of our new variable teaser_3_words over time.

MapNewsData <- MapNewsData %>% 
    tidyr::separate(datetime, 
          into = c("month", 
                  "day", 
                  "year", 
                  "at", 
                  "hour", 
                  "min")) %>% # I know this works
    dplyr::mutate( # new variables
         month = match(month, month.name), # month.name is loaded with R
           day = as.numeric(day), # make numeric day
          year = as.numeric(year), # # make numeric year
      am_or_pm = str_sub(min, 
                           start = 3, 
                             end = 4),  # break up min from AM/PM
          hour = if_else(am_or_pm %in% "PM", # condition for 24H time
                 as.numeric(hour) + 12, # 24 hour
                 as.numeric(hour)),
        minute = str_sub(min, 
                         start = 1, # get the minute elemets
                           end = 2),
                    min = as.numeric(minute), # format the minutes
          date = make_date(
                   year = year,
                  month = month,
                    day = day),
      datetime = lubridate::make_datetime( # create the datetime
                   year = year, 
                  month = month, 
                    day = day, 
                   hour = hour, 
                    min = min))

First three teaser words over time

I want to look at the proportions of the first three words in teasers over time. This can serve as a crude estimate for how much the first three words of a teaser vary in proportion to the total number of teasers. I can do this by faceting like I did above, or I can use the cowplot::plot_grid() function to separate these graphs by news feed.

In order to use this function, I need to load the cowplot library. Then I want to split the data by the data_id_fct to create two plots with the tease_3rd_prop on the x axis and datetime on the y axis.

# create data subset
MapNewsData_Prop_Data <- MapNewsData %>% 
    arrange(desc(tease_3rd_prop)) %>% 
    dplyr::select(data_id_fct, 
                  tease_3rd_prop,
                  teaser_3_words,
                  datetime) 
MapNewsData_Prop_Data %>% glimpse(75)
## Observations: 1,075,720
## Variables: 4
## $ data_id_fct    <fct> Abc7, Abc7, Abc7, Abc7, Abc7, Abc7, Abc7, Abc7,...
## $ tease_3rd_prop <dbl> 0.02217, 0.02217, 0.02217, 0.02217, 0.02217, 0....
## $ teaser_3_words <fct> President Donald Trump, President Donald Trump,...
## $ datetime       <dttm> 2017-10-31 18:49:00, 2017-10-31 18:49:00, 2017...

Now I am going to create a base line plot. This allows me to set the colors for the text lables in the next geoms.

# create base line plot
MapNewsLinePlot <- MapNewsData_Prop_Data %>%
        ggplot2::ggplot(aes(x = datetime, 
                        y = tease_3rd_prop,
                        color = data_id_fct,
                        label = teaser_3_words)) + 
        ggplot2::geom_line(aes(group = data_id_fct)) 
MapNewsLinePlot

MapNewsLinePlotData-1

I want to know what the specific colors are in this plot. It turns out, all that information is stored in a data frame I can access using ggplot2::ggplot_build().

# get colors in this plot
MapNewsLinePlotData <- ggplot2::ggplot_build(MapNewsLinePlot)$data[[1]]
MapNewsLinePlotData %>% distinct(colour)
##    colour
## 1 #F8766D
## 2 #00BFC4

With my two color codes, I can set the color argument in the geom_text() for the highest occurring proportions.

MapNewsData_Prop_Plot <- MapNewsLinePlot +
        ggplot2::geom_text(data = filter(MapNewsData,
                                    tease_3rd_prop >= 0.020 &
                                    datetime <= "2017-11-15"),
                                    aes(label = teaser_3_words),
                                        vjust = 2,
                                        hjust = 1,
                                        show.legend = FALSE,
                                        color = "#F8766D") +
            ggplot2::geom_text(data = filter(MapNewsData,
                                    tease_3rd_prop >= 0.020 &
                                    datetime >= "2017-11-15" & 
                                    datetime <= "2017-12-7"),
                                    aes(label = teaser_3_words),
                                        vjust = 0.7,
                                        hjust = 0.9,
                                        show.legend = FALSE,
                                        color = "#F8766D") +
            ggplot2::geom_text(data = filter(MapNewsData,
                                    tease_3rd_prop >= 0.020 &
                                    datetime >= "2017-12-7"),
                                    aes(label = teaser_3_words),
                                        vjust = 2,
                                        hjust = 0.09,
                                        show.legend = FALSE,
                                        color = "#F8766D") +
            ggplot2::geom_text(data = filter(MapNewsData,
                                    tease_3rd_prop > 0.015 &
                                    datetime <= "2017-09-01"),
                                    aes(label = teaser_3_words),
                                        vjust = 0.9,
                                        hjust = 0.1,
                                        show.legend = FALSE,
                                        color = "#00BFC4") +
            ggplot2::geom_text(data = filter(MapNewsData,
                                    tease_3rd_prop > 0.015 &
                                    datetime >= "2017-11-01" & 
                                    data_id_fct == "Kcra"),
                                    aes(label = teaser_3_words),
                                        vjust = 0.9,
                                        hjust = 0.1,
                                        show.legend = FALSE,
                                        color = "#00BFC4") +
            ggplot2::theme(legend.position = "top") +
            ggplot2::labs(x = "Date",
                      y = NULL,
                      color = "News Feed",
                      caption = "Proportion First Three Words Appeared") + 
            ggplot2::ggtitle("ABC7 & KCRA Teaser First Three Word Occurrences July 18 to January 16")
MapNewsData_Prop_Plot

MapNewsData_Prop_Plot

ggsave("./image/MapNewsData_Prop_Plot.png", width = 7, height = 5, units = "in")

This gives us an idea for when a certain teaser or headline spiked in coverage between July and January in 2018.

The post Getting started with stringr for textual analysis in R first appeared on Storybench.

Weekly readings for #pubmedia, Feb. 19, 2018

Got 5 inches of snow overnight Sat./Sun., but the temperature could reach 70° on Wednesday.  We live in hope.  Here is a compilation of recent selected links from my @haarsager Twitter feed.  --Dennis

Broadband/Wireless

Why broadband competition at faster speeds is virtually nonexistent.  Vice Motherboard

Digital Video/VOD/OTT

must read  Smartphone video, connected TV increase penetration and usage.  nScreenMedia

Management/Strategy

What makes public radio ‘very personal’ magnifies its #metoo cases.  New York Times

Trolling as a business model is making trollery the dominant form of American discussion.  Umair Haque in Medium

Trump’s budget again proposes elimination of Public TV [and radio] … funding.  Variety

A profit model for 21st century journalism.  Michael Rosenblum in Medium

Radio/Podcasting/Digital Audio

Public radio’s public reckoning.  Village Voice

Repack

Bill to address repack shortcomings advances.  TVTechnology

FCC will open April window for auction-displaced LPTVs.  Broadcasting & Cable

Social Media

Confessions of a publishing consultant on Facebook’s news feed changes.  Digiday

Twitter begins broadcasting local TV news during breaking news events.  FierceCable

must read  TV nets missing opportunity with Instagram.  nScreenMedia

Television

Why have TV viewers stopped channel surfing?  MediaPost

Netflix has taken $3B-$6B of TV ad revenue off the table.  nScreenMedia

Weekend readings for #pubmedia, Feb. 9, 2018

Here is the latest compilation of selected links from my @haarsager Twitter feed.  --Dennis

ATSC 3.0/Next-Gen TV/HbbTV

Digital Video/OTT/VOD

  • 5% of U.S. broadband users subscribe to a vMVPD.  FierceCable
  • must read  Shift in ad spending from TV to OTT expected over next two years.  Video Nuze
  • must read  How Die Welt gets people to watch video on its own site.  Digiday
  • must read  Facebook deëmphasizes news feed video; users’ time spent drops.  Video Nuze  …and…  The local-national news divide on Google and Facebook.  Axios
  • SVODs to boost original content annual spend to $10B by 2022.  TVTechnology
  • U.S. viewers have a love/hate relationship with live streaming.  Rapid TV News
  • Most use smart TVs to stream, won’t displace Roku anytime soon.  nScreenMedia

Journalism

  • YouTube announces it will start flagging videos published by organizations that receive government funding.   The Hill
  • Martha Raddatz: Media ‘watching each other a little more’ after missteps reporting on Trump.  Politico
  • must read  Why news publishers should consider the “smart curation” market.  Frederic Filloux in Monday Note

Radio/Podcasting/Digital Audio

  • must read (TV too)  Local radio’s digital future.  Jacobs Media Strategies
  • Paid listens on...  RadioPublic
  • must read  Podcast listeners really are the holy grail advertisers hoped they’d be.  Wired

Repack

Strategy/Business/Management

Television

  • TV, video ad growth pinned to advanced TV efforts.  MediaPost
  • 4K TVs build market presence as global LCD TV shipments fall to three-year low.  Rapid TV News
  • Inside Jeffrey Katzenberg’s billion-dollar bet to crack the code on mobile video.  Digiday

Weekend readings for #pubmedia, Jan. 26, 2018

Just became unburied from a lengthy writing project, so took a pass on doing this last weekend.  So this collection of links from http://www.twitter.com/haarsager covers the past couple of weeks.  --Dennis

ATSC 3.0/Next-Gen TV/HbbTV

  • ATSC 3.0: Broadcasters tout standard’s power ahead of full implementation.  Cablefax 
  • Sinclair, Nexstar team up with American Tower for ATSC 3.0 SFN sites in Dallas.  FierceCable
  • FCC ponders giving broadcasters ATSC 3.0 carriage flexibility.  Broadcasting & Cable

Digital Video/VoD/OTT

  • must read  Video’s peril – and promise.  Steven Rosenbaum in MediaPost
  • Growing pains for OTT.  TVTechnology
  • Customer experience, usage data can get lost in SVOD distribution deals.  nScreenMedia
  • Why you need a comprehensive OTT strategy.  Nielsen  …and…  Cutting-edge content from digital publishers keeps millennials coming back for more.  Nielsen

Journalism

  • must read  It’s time for journalism to build its own platforms.  Heather Bryant in Monday Note
  • The Guardian heads back into the black.  The Economist

Radio/Podcasting/Digital Audio

Strategy/Management/Business

  • A broadcaster’s guide to Washington issues.  David Oxenford & David O’Connor in TVNewsCheck

Social Media

  • must read  How Facebook’s media divorce could backfire.  Vanity Fair  …and…  Facebook’s move to deemphasize video in news feed has consequences.  Video Nuze  …and…  Facebook’s news feed changes sees brand videos taking hit.  Rapid TV News  …and…  We were all feeling hostage to Facebook.  Digiday  …and… Facebook is done with quality journalism. Deal with it.  Frederic Filloux in Monday Note

Television

  • Groups likely to expand program production.  TVNewsCheck
  • The 360-degree news video siren song.  TVTechnology
  • ‘8K? I don’t even have 4K yet?’ The future of television is still far off.  Digital Trends

Weekend readings for #pubmedia, Jan. 14, 2018

Here is this week’s compilation of selected links from my @haarsager Twitter feed.  CES is responsible for a few entries.  --Dennis

ATSC 3.0/Next-Gen TV/HbbTV

  • Hands-on with 3.0 OTA TV at CES.  Cord Cutters News
  • ATSC 3.0 standard approved, Technicolor HDR proposal expected as part of standard.  CEPro
  • LG plans ATSC 3.0 4k broadcast testing in U.S. this year.  hdreport

Broadband/Wireless/Spectrum

  • AT&T reined in 600-MHz bidding as it closed in on FirstNet.  FierceWireless  …and…  AT&T looks to sell remaining 600-MHz spectrum.  FierceWireless
  • must read  600-MHz incentive auction ‘extravaganza’ ends with a whimper.  FierceWireless
  • Was the spectrum auction necessary?  Radio Magazine

Consumer Electronics

Digital Video/VOD/OTT

  • TiVo: 20% of daily life spent with video.  Video Nuze
  • TV sets remain as prime device for VOD viewing.  Rapid TV News

Radio/Podcasting/Digital Audio

  • must read (TV, too)  How public radio’s risk-adverse culture impedes its chances for success.  Eric Nuzum in Current

Repack

Social Media

  • The problem with Facebook.  MediaPost
  • must read  Facebook tells publishers big change is coming to News Feed.  Digiday

Television

  • must read  TV still claims most-favored screen status.  Rapid TV News  …and…  TV sets remain as prime device for VOD viewing.  Rapid TV News  …and… Three-quarters of U.S. consumers have a connected TV.  Rapid TV News
  • TiVo: 20% of daily life spent with video.  Video Nuze

This weeks readings for #pubmedia, 8 Jan. 2018

First compilation of the new year: This week’s selected links from my @haarsager Twitter feed.  --Dennis

ATSC 3.0/Next-Gen TV/HbbTV

  • Sony, Pearl TV partner for ATSC 3.0 next-gen TV program guide.  FierceCable
  • On tap for TV at CES: 3.0, voice, gadgets.  TVNewsCheck
  • Free TV keeps getting better: Welcome ATSC 3.0.  ElectronicDesign
  • ATSC 3.0: Now it’s up to us.  TVTechnology

Broadband/Wireless

  • AT&T plans to launch mobile 5G in a dozen cities by late 2018.  FierceWireless
  • ‘Alarming’ unlimited [smartphone] data usage: 31.4 GB per month and rising.  FierceWireless

Digital Video/OTT/VOD

  • 2018 could be the year Facebook banishes news from its feed.  Digiday
  • Streaming becomes mainstream as cord-cutting accelerates.  Chicago Tribune

Journalism

  • must read  Fewer Americans rely on TV news; what type they watch varies by who they are.  Pew Research
  • 2018 could be the year Facebook banishes news from its feed.  Digiday
  • Reporters, once set against paywalls, have warmed to them.  Digiday

Radio/Podcasting/Digital Audio

Social Media

  • 2018 could be the year Facebook banishes news from its feed.  Digiday

Strategy/Management/Legal

  • The great consolidation: How 2017 paved the way for the next gilded age of television.  Paste Magazine

Television

  • 487 original programs aired in 2017. Bet you didn’t watch them all.  New York Times
  • Record number of OLED TVs shipped at end of 2017.  Rapid TV News
  • must read  Live TV and movie habits to continue sharp decline in 2018.  nScreenMedia

Research Director Jonathan Albright on Russian Ad Networks

This week, Research Director Jonathan Albright has published a number of articles on research about Russian ad networks and their influence during the 2016 election. Look at Jonathan’s dataset, and follow him on Medium, for more.

Research

The Washington Post, 10/5, “Russian propaganda may have been shared hundreds of millions of times, new research says.” Read here.

“The primary push to influence wasn’t necessarily through paid advertising,” said Albright, research director of the Tow Center for Digital Journalism at Columbia University. “The best way to to understand this from a strategic perspective is organic reach.”

In other words, to understand Russia’s meddling in the U.S. election, the frame should not be the reach of the 3,000 ads that Facebook handed over to Congress and that were bought by a single Russian troll farm called the Internet Research Agency. Instead, the frame should be the reach of all the activity of the Russian-controlled accounts — each post, each “like,” each comment and also all of the ads. Looked at this way, the picture shifts dramatically. It is bigger — much bigger — but also somewhat different and more subtle than generally portrayed.

The New York Times, 10/9, “How Russia Harvested American Rage to Reshape U.S. Politics.” Read here.

“This is cultural hacking,” said Jonathan Albright, research director at Columbia University’s Tow Center for Digital Journalism. “They are using systems that were already set up by these platforms to increase engagement. They’re feeding outrage — and it’s easy to do, because outrage and emotion is how people share.”

All of the pages were shut down by Facebook in recent weeks, as the company conducts an internal review of Russian penetration of its social network. But content and engagement metrics for hundreds of posts were captured by CrowdTangle, a common social analytics tool, and gathered by Mr. Albright.

The Washington Post, 10/9, “Add Google to the list of tech companies used by Russians to spread disinformation.” Read here.

Facebook said last week that modeling showed that 10 million people saw the Russian-bought ads bought by the 470 pages and accounts controlled by the Internet Research Agency. But Albright, the Columbia social media researcher, reported soon after that free Facebook content affiliated with just six of those 470 pages and accounts likely reached the news feeds of users hundreds of millions of times.

Albright also has found links to Russian disinformation on Pinterest, YouTube and Instagram, as well as Twitter, Facebook and Google. Clicking on links on any of these sites allowed Russian operatives to identify and track Web users ­wherever they went on the Internet.

Coverage

Rachel Maddow, audio clip from 10/9. Watch here.

(Again, you can look at Jonathan’s dataset, or follow him on Medium.)