We’re currently looking for interns for spring 2016!
We want to see your best work.
Here’s how.
Cover letters
All candidates must submit a cover letter. Your cover letter should be a statement of purpose. We’re interested in what you’re passionate about and why you’re passionate about it. (Most cover letters tell us that you are hardworking, passionate and talented, etc. And that you love NPR. We don’t need you to tell us that.)
- Tell us what you care about and work on.
- Tell us why you are passionate about your work.
- Tell us why this opportunity will help you reach your potential.
- Tell us how you will contribute to our team.
Other expectations
- Photo internship candidates must have a portfolio.
- Programming/design candidates with either projects on Github or a personal site are strongly preferred.
Selection process
After you submit a resume and cover letter, our selection committee will read through all the applications. We’ll reduce the list to approximately 8-10 candidates by eliminating applications that don’t have a cover letter and resume or who clearly aren’t a good fit for the team.
If you’re one of these candidates, two or three folks from the Visuals team will conduct a 30 minute Skype interview with you. You’ll get an email before your interview with outline of the questions you’ll be asked in the interview and also given the opportunity to ask any questions beforehand. The questions may vary a bit from interview to interview based on your professional experience, but we will be as consistent as possible.
Then we’ll call references and conduct some follow-up via email, possibly asking one or two more substantial, interview-style questions. Email communication is crucial in our workplace, and gives us an opportunity to see how you communicate in writing. We expect that answers are prompt, succinct, and clear.
We’ll follow up with all of our finalists with some constructive criticism about their application and interview.
Who we are
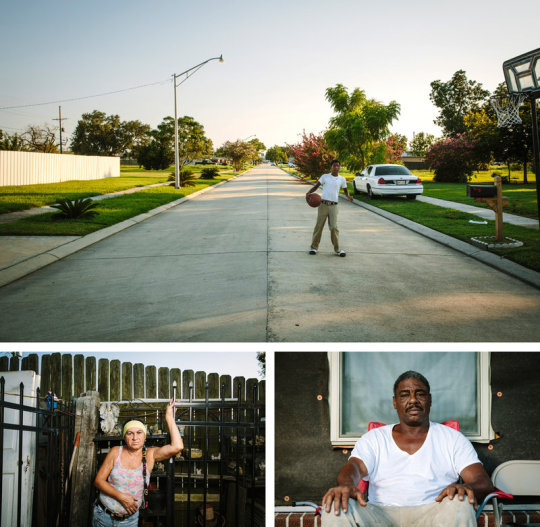
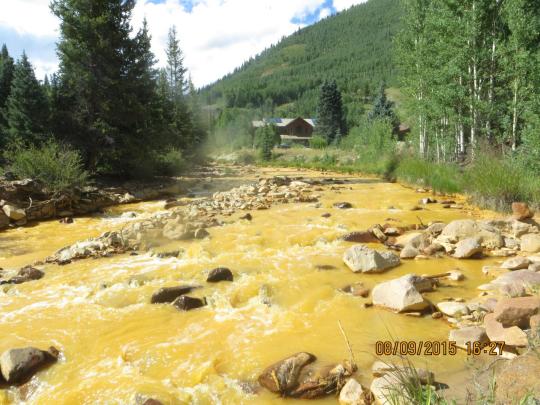
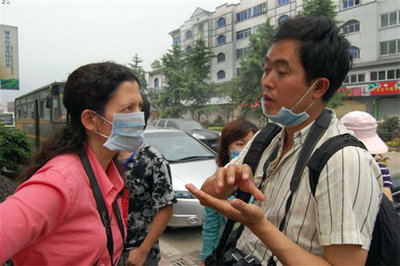
We’re a small group of photographers, videographers, photo editors, developers and designers in the NPR newsroom who make visual journalism. (Yeah, NPR is a radio thing, and yeah, it’s weird sometimes.) Check out our latest stuff!
Why we’re doing this
Everyone on the Visuals team wants to open our field to the best people out there, but the process doesn’t always work that way. So we’re trying to make the job application process more accessible.
Applicants with strong cover letters and good interview skills naturally tend to do well in this process. Often, those skills are a result of coaching and support — something that not all students are privileged to have. To help candidates without those resources, we’re being more transparent about our process and expectations.
We’re certain that we’re missing out on candidates with great talent and potential who don’t have that kind of support in their lives. We think knowing our cover letter expectations and interview questions ahead of time will help level the playing field, keep our personal bias out of the interview process, and allow better comparisons between candidates.
Apply!
Photo editing
Our photo editing intern will work with our digital news team to edit photos for npr.org. It’ll be awesome. There will also be opportunities to research and pitch original work.
Please…
- Love to write, edit and research
- Be awesome at making pictures
Are you awesome? Apply now!
Design and code
This intern will work as a designer and/or developer on graphics and projects for npr.org. It’ll be awesome.
Please…
- Our work is for the web, so be a web maker!
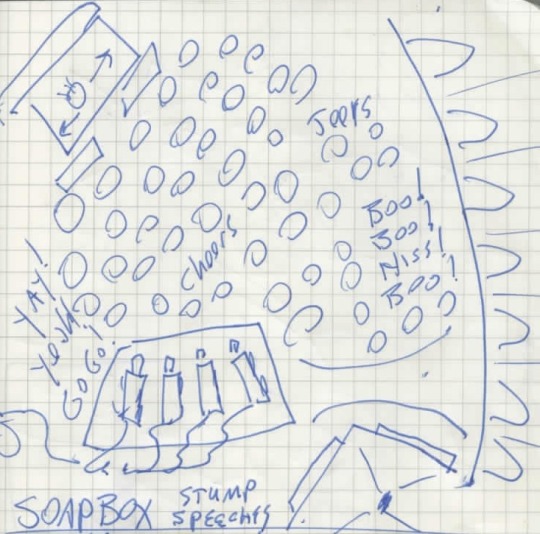
- We’d especially love to hear from folks who love illustration, news graphics and information design.
Are you awesome? Apply now!
What will I be paid? What are the dates?
The deadline for applications is November 1, 2015.
Check out our careers site for much more info.
Thx!