This piece first appeared on Medium from the Tow-Knight Center at CUNY’s Graduate School of Journalism.
Whatever happens next, I am always going to blame Hunter Page and his damn fool questions for starting me off on this journey. Hunter: “Pete, how are we going to save journalism?” Me: “Save journalism? I dunno.” Hunter: “But you must, we must. How are we going to know what’s going on when all the journos are sacked?”
That was almost four years ago, and yes, journalism did look a tad sick. I for one was out of a job, working out what to do next after taking a payout from the Sydney Morning Herald. (My best answer was starting PolitiFact Australia, an offspring of the Pulitzer prize-winning fact-checking service currently doing wonders for Donald Trump.)
Peak Content?

Chugach Mountains, Alaska. Photo by Paxson Woelber and used with Creative Commons license.
You’d be forgiven for thinking that journalism still appears a bit unwell, even though I can see plenty of reasons to be optimistic. Most legacy media companies are having to cut away at the cost base to cope with falling revenues. It would be great to see them paying as much attention to revenue innovation as cost reduction. But, hey, that’s another article.
Yes, journalism is going through a massive change and many journos have been sacked. About 1600 full-time positions have gone in Australia over the past five years. It is happening across the world.
But we, the public, still know what’s going, or to be more accurate, there’s still plenty of content out there. Masses. Sure, roughly half of it seems to be about cats and Kardashians, but if you have the time, you can read more and more widely now than ever before.
In fact, as Kevin Anderson recently argued in Media Briefing, we’ve probably reached Peak Content: the point at which the glut of “things to read, watch and listen to becomes completely unsustainable”.
Anderson, a media consultant, online innovator and former executive editor at Gannett, writes: “One of the few workable business models in this age of digital disruption has been to produce as much content as cheaply as possible.
“But flooding a glutted market only leads to a deflationary spiral until it becomes completely uneconomic to produce that commodity. It is a simple matter of economics, and it doesn’t matter whether that commodity is maize or media.”
It’s not only the journos pumping out the content; though my guess is that most journalists in full-time employment are pushing out about twice as much journalism now than they did a decade or so ago — and across an ever-growing number of platforms. I mean, who’d thought the Wall Street Journal would launch on Snapchat?
By the middle of last year there were 400 hours of video being uploaded to YouTube every minute, Anderson notes. That’s probably grown by more than 10 per cent since then. And that’s before we starting counting the daily avalanche of shared social media posts.
I don’t know if we’ve actually reached peak content — will someone shout “OK, everybody, you can stop filing”, when we get there? — but the glut of material is why another of Hunter’s question rings far truer and louder than his first: “In a world awash with content, how do you know who or what to trust?”
And, to add my own, who’s going to pay for all this journalism? (Anderson contends the media industry has reached the point where ad revenues won’t support current outputs.)
And how are we — the audience — going to value it?
Yes, that’s something to have a crack at for sure. Jeff Jarvis, the resident agent provocateur at City University New York’s graduate school journalism, where I am currently studying, argues that journalism needs to redefine its mission, that seeing ourselves as content creators is a trap. A more productive and sustainable idea is, he argues in “Geeks Bearing Gifts,” journalist as service provider.
“Consider journalism as a service. Content is that which fills something. Service is that which accomplishes something. To be a service, news must be concerned with outcomes rather than products. What should journalism’s result be? That seems obvious: better-informed individuals and a better informed society.”
This all sounds, well, nice and kinda common sense. A better-informed public? What’s not to like. Most journalists would consider what they do as a service to readers.
But, as Jarvis argues, it is the journalists who have defined the terms of that service rather than the public. That’s the bit that has changed. Forever.
“This idea of outcomes-oriented journalism requires that we respect the public and what it knows and needs to know. It forces us to stop thinking that we know better than the public. It leads us to stop thinking that we know better than the public. It leads us to create systems to gather the public’s knowledge.”
The Divine Right of the Editor
And, to be frank, most journalists and editors are pretty poor at understanding or even wanting to understand what the public thinks. The Divine Right of the Editor is an addictive drug to quit. I know.
I also know that despite the co-dependence of journalists and their readers (certainly from the journo side), many editors still have trouble seeing the relationship as an equal partnership or in fact one in which the audience should by rights have the upper hand.
A small example: one of my proudest moments as editor-in-chief of the Herald was to establish an independent in-house readers’ editor/quasi ombudsman, a senior member of staff whose job it was to question the decisions, practices and methods of the masthead and its editors in response to reader inquiries.
Soon after I left the Herald, my successor closed the job down. His rationale: why waste good money paying someone to shit in the paper’s own nest. Sure, he’s more than entitled to make hard calls. They were and still are tough times. But what sort of message did that action send to the readers? They are the last people you want to put off side. Right?
Anyway, back to Hunter, whom I should have mentioned isn’t a journalist. His mum and sister are. He’s in finance.
Hunter: “In a world awash with content, who are you going to trust.”
Well, I think we still can and should trust journalists and journalism, but, as Jarvis says and I’ve opined about before, we also have to listen to what the audience wants and needs.
We have to either make, find or share the tools that allow that listening to happen and we have to be entirely transparent about the how, what and why we are doing.
One of the many lessons from PolitiFact was the importance of listening, explaining and having an ongoing relationship with the audience. You can never do enough. On reflection, I should have done more. Next time. This time.
So, with the words of Page, Jarvis, Anderson and many others ringing in my ears, I’ve been thinking about a new journalism service, currently called GoClevr, that will curate and aggregate the sharpest, most insightful and, sometimes the most surprising, analysis, opinion and commentary by journalists.
It will give readers who don’t have the time to find their favourite bylined journalists or discover new ones, a daily digest of the best stuff going around.
Initially, I will curate the material (and if you are interested, please sign up to the coming-soon newsletter; details on the site) but the plan is to give readers the ability to pick the subjects and the authors they like.
GoClevr will listen and learn from the readers. It will give readers the information to make informed decisions about current events.
This is not the first idea in this space and it won’t be the last. But most other aggregators mainly offer news articles (and let’s face it, news is everywhere) and they don’t curate via the byline or author.
I have a few more ideas about how GoClevr will stand out from the pack, how it will work across publishers and most importantly, how it will deliver value to readers, journalists and publishers but I will save them for the next post.
Right now this is a voyage of discovery. Working with others, at CUNY and with people in Sydney and Zurich, I am trying to work out if whether it is something readers will value. I don’t know the answer yet and I won’t really know until GoClevr starts publishing and gaining feedback.
But I do think gaining insights into current events is a valuable commodity and many journalists, young and old, known and unknown, have something to contribute.
The challenge of age is to climb up and over Peak Content and bring back only the good stuff. That is the challenge I want to take on, with or without oxygen. Watch out for more updates.
I’d like to acknowledge the support of Sakura Sky, Hunter Page, Richard McLaren, Alistair Munro, and my peers and colleagues at University Technology Sydney and CUNY, especially Jeremy Caplan.
Peter Fray is an Australian editor, journalist and recent academic. He is currently a digital entrepreneurial fellow at CUNY and a professor of journalism practice at University of Technology Sydney and the former editor-in-chief or editor of The Sydney Morning Herald, The Sun-Herald, The Sunday Age and the Canberra Times. In 2013, he founded the fact-checking PolitiFact Australia and until joining UTS in late 2015, was the deputy editor of The Australian. After 30 years in journalism, he is starting to listen to the audience.


 From
From  nd
nd From
From 


 All Songs Considered asks listeners for their favorite albums of 2016
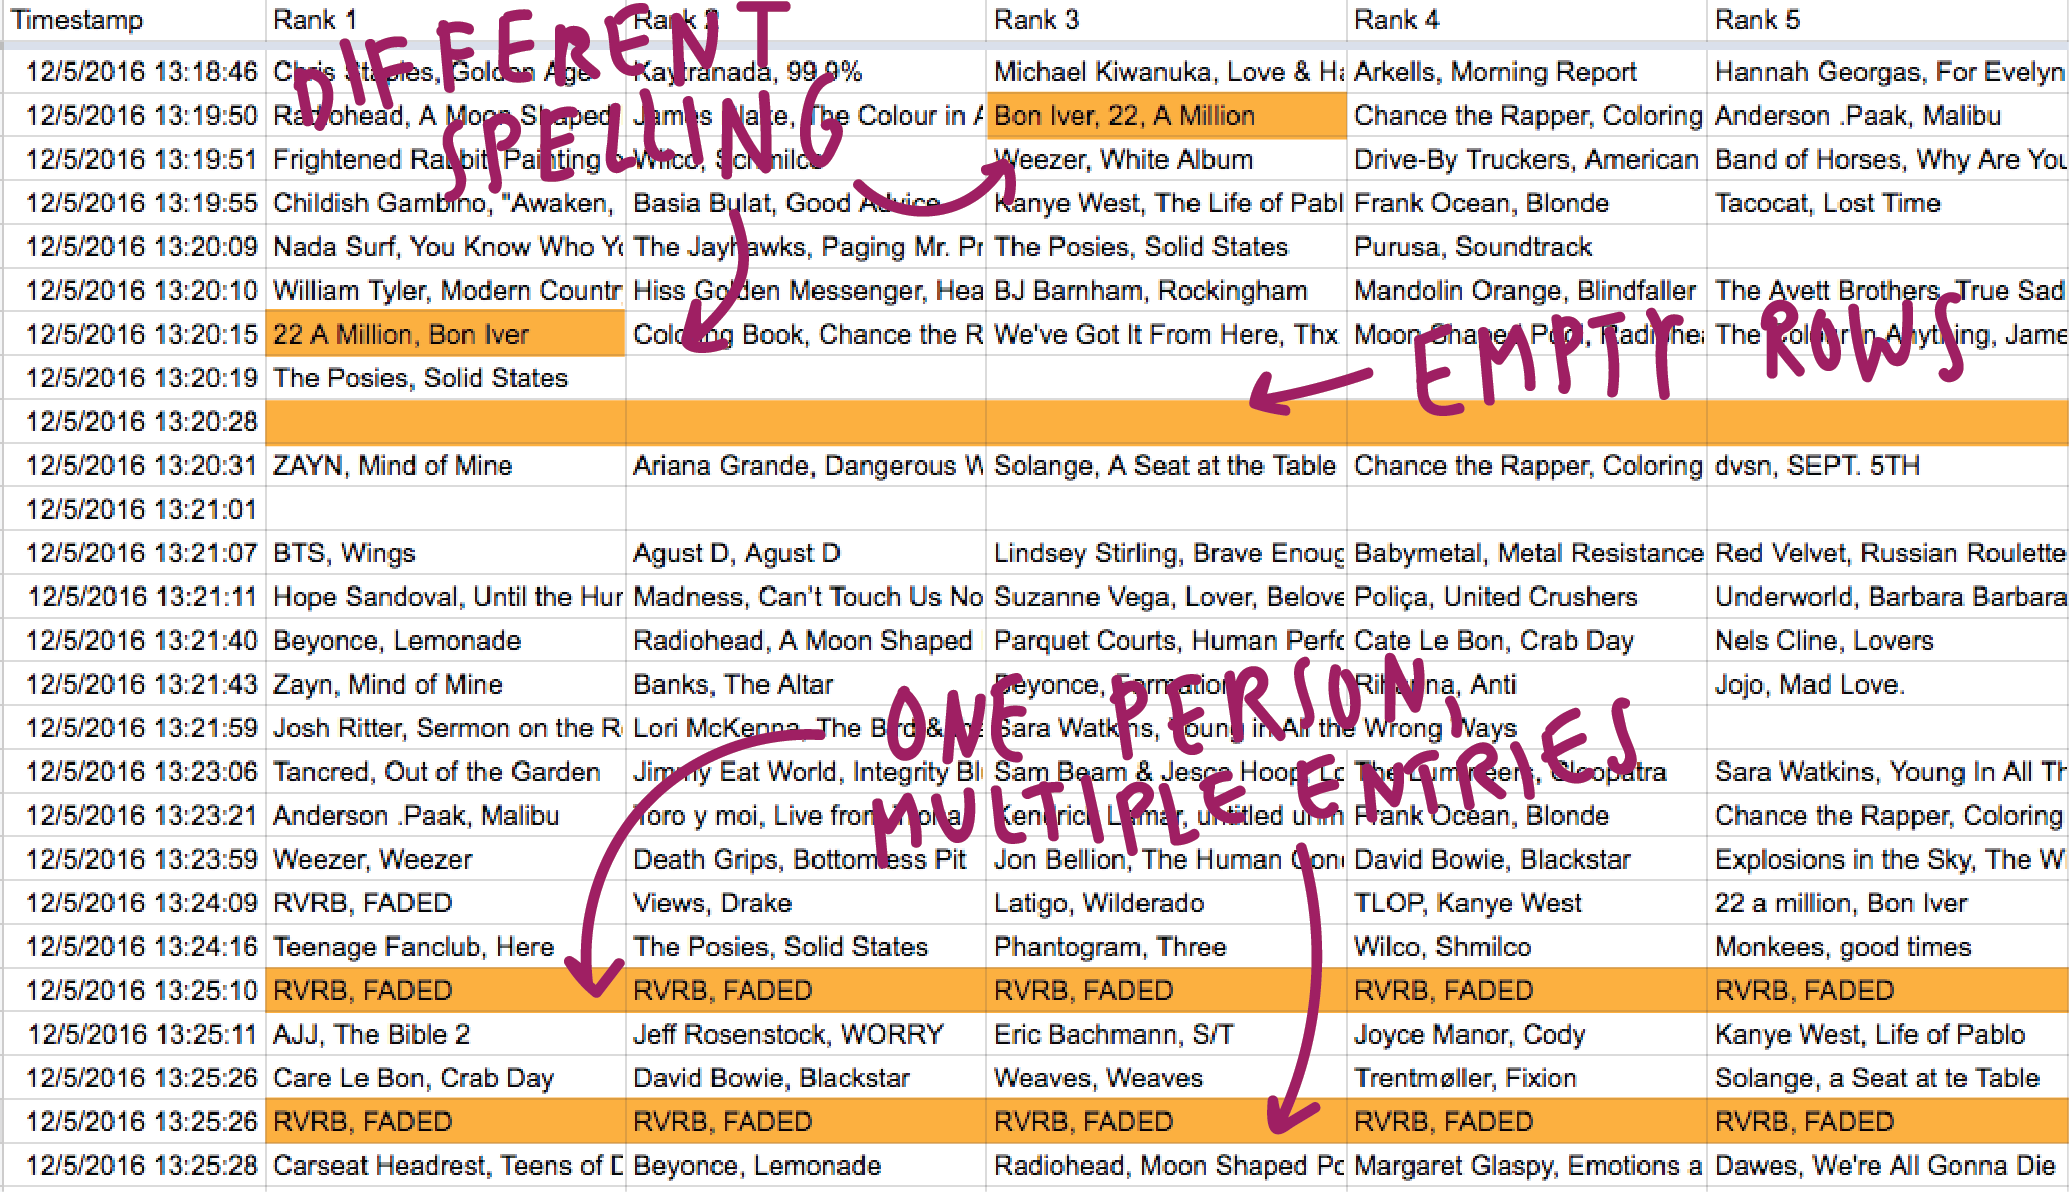 Different spelling, empty rows, multiple entries by one person: Ugh
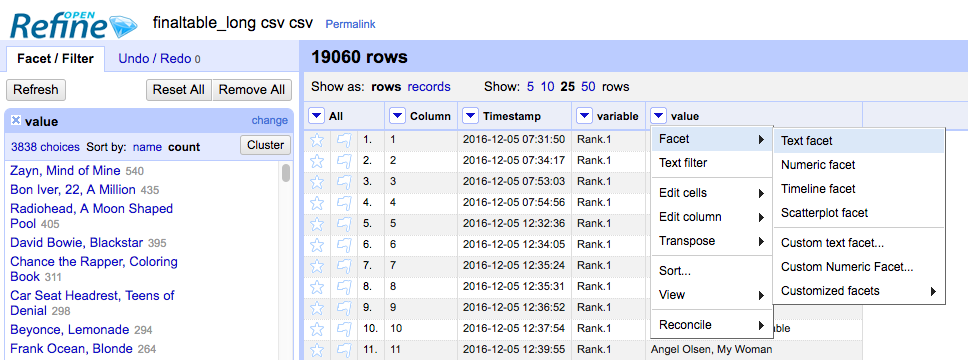 Text Facet in OpenRefine
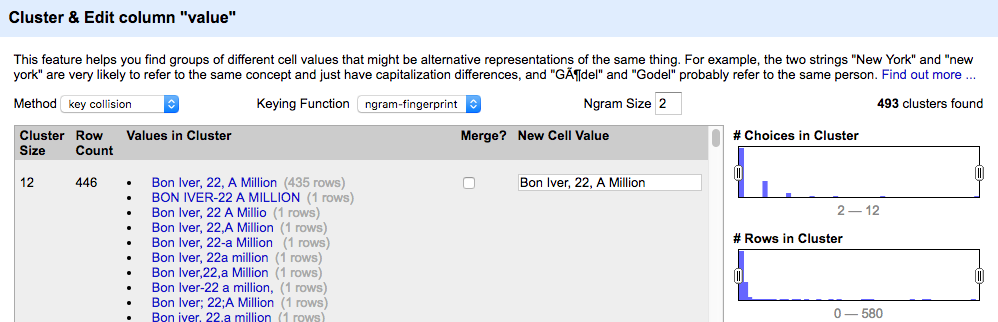 Clustering in OpenRefine
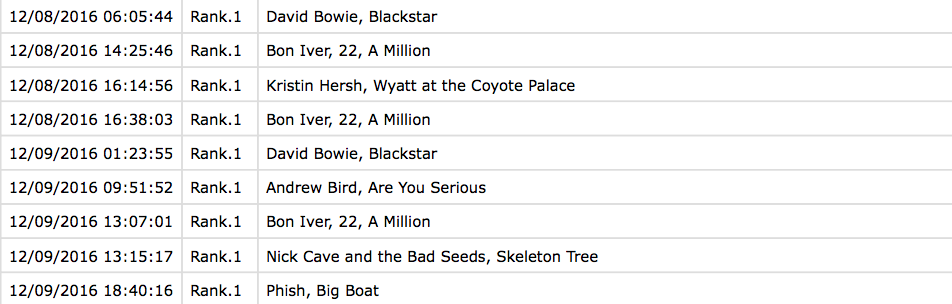 Data with ranks in long format
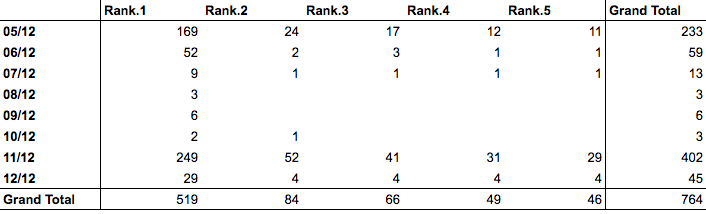 The table shows how often Zayn’s Mind of Mine was mentioned on all days of the poll. He was really successful on the first and the second-to-last day.
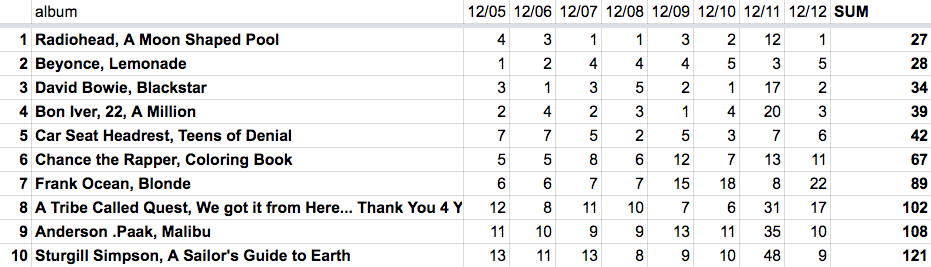 The final ranking: the sum of the rankings for each day.
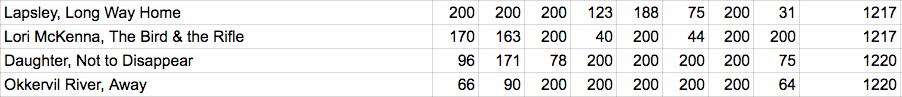 We replaced empty values with a high number, so that they didn’t show up at the top of the ranking


 Photo by Rachael Ketterer
 in virtual reality](http://blog.apps.npr.org/img/posts/vr-screenshot.jpg) A screenshot of
A screenshot of 
 A screenshot of our elections app titlecard during Mega Tuesday on March 15, 2016.
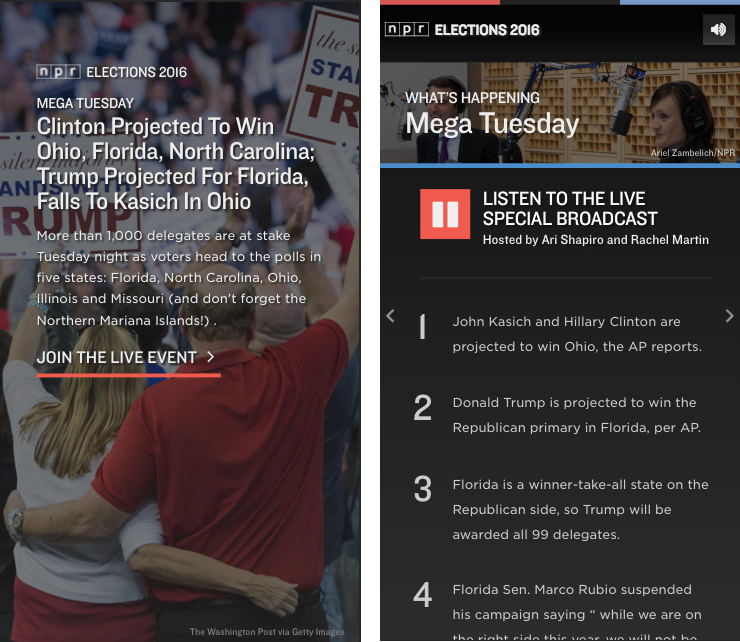 Screenshots of the first two cards of our app during our live broadcast on Mega Tuesday, March 15, 2016.
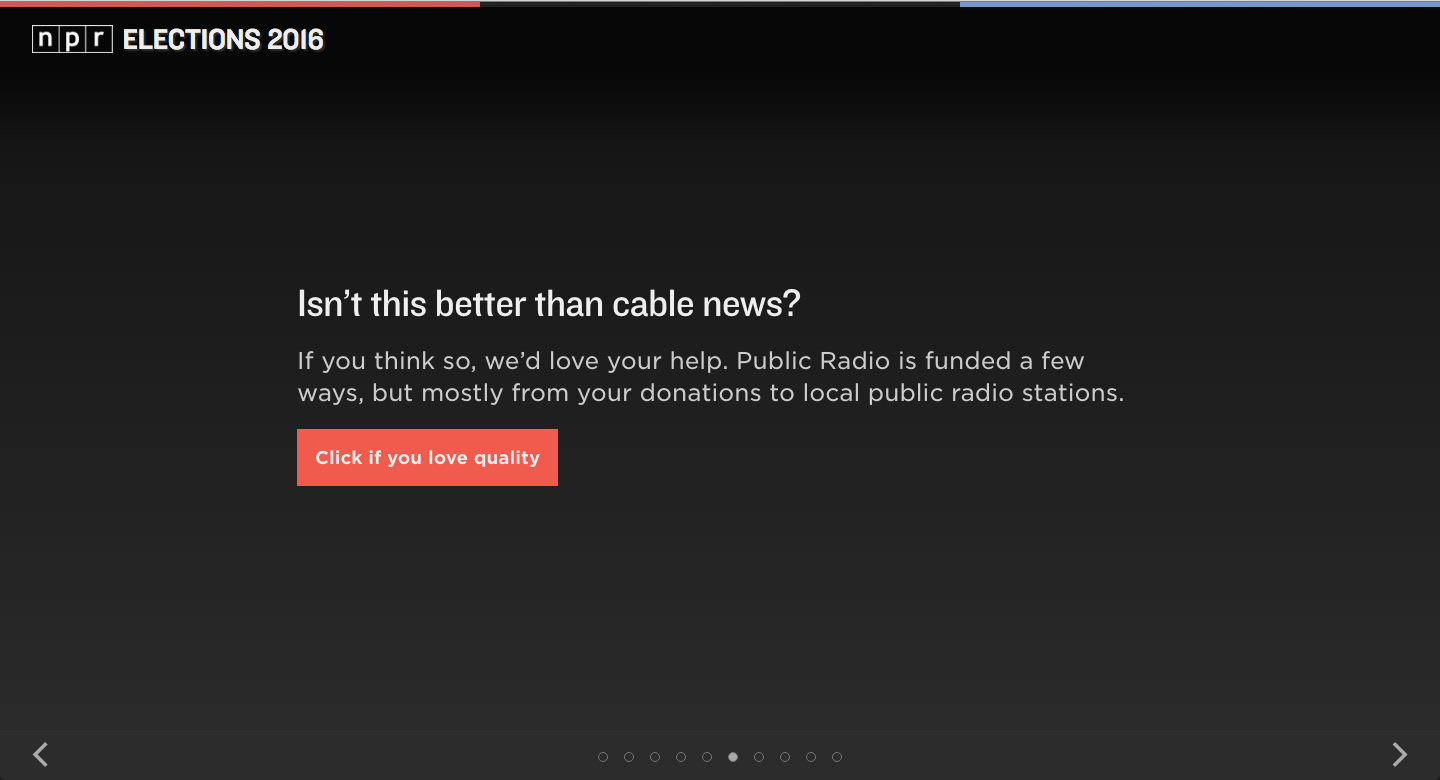


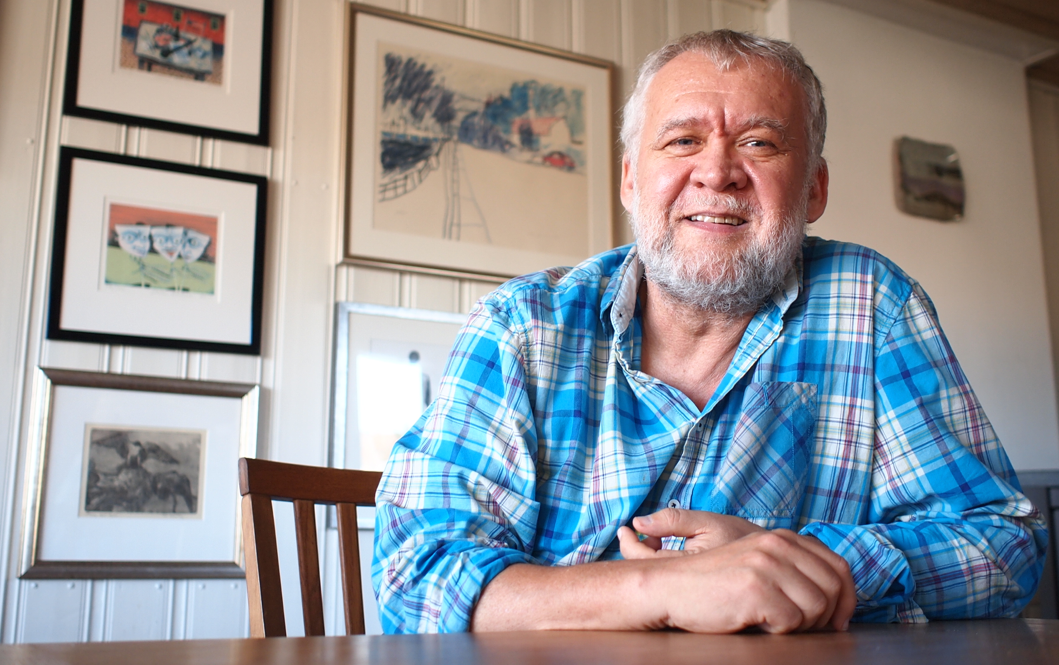
 Illustration by viz team intern Annette Elizabeth Allen!


